What it is
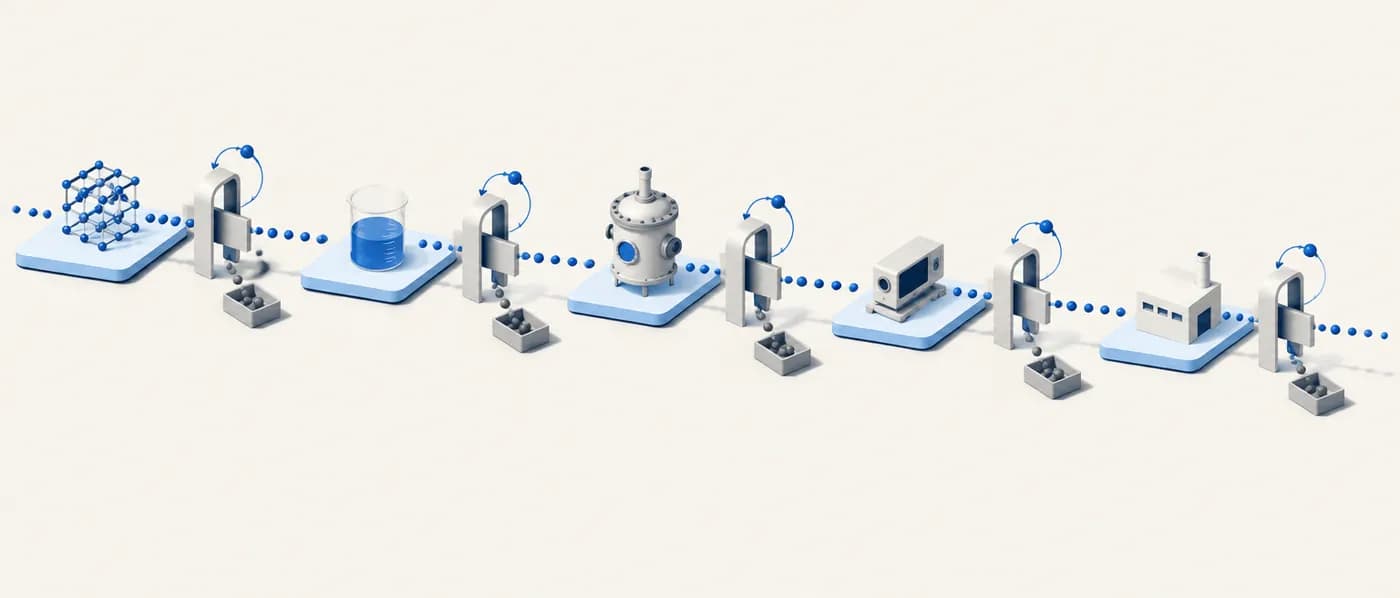
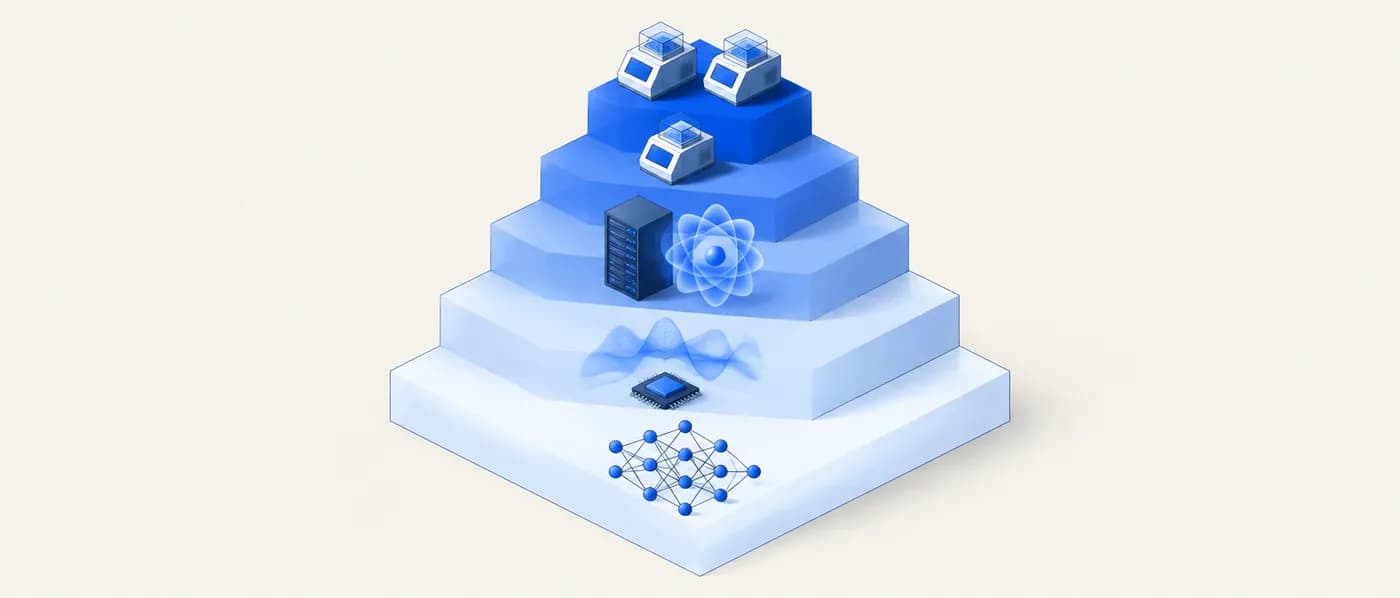
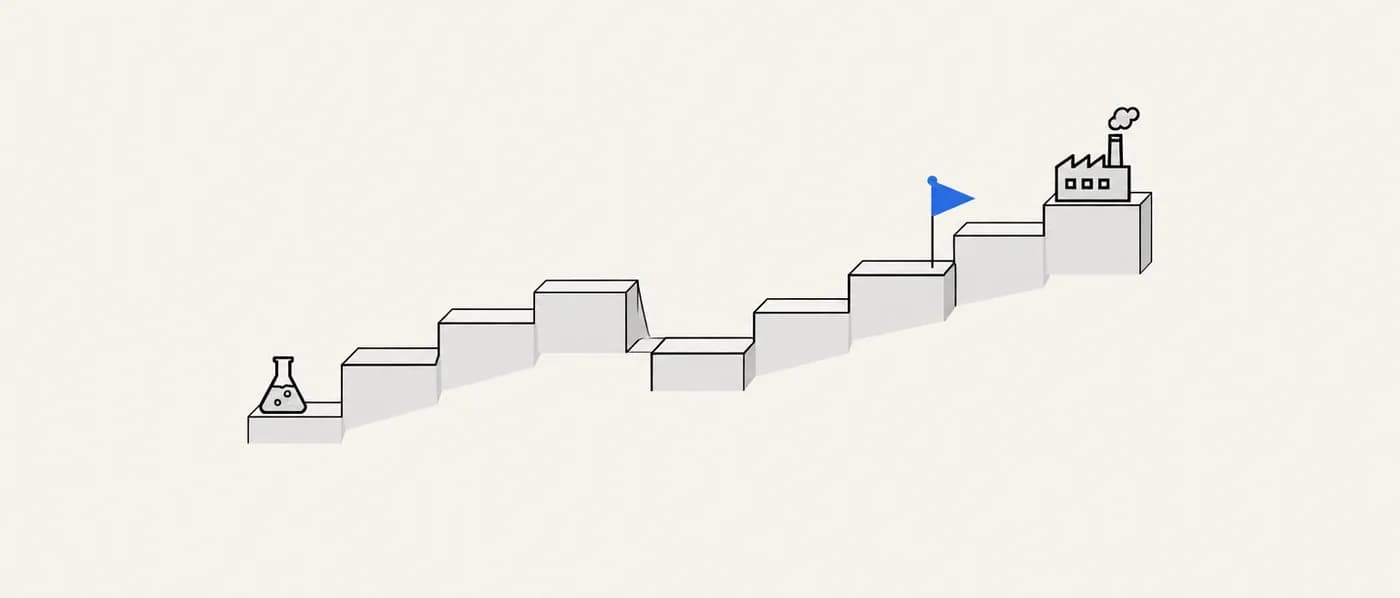
Technology Readiness Levels (TRLs) are a nine-point scale for describing the maturity of a technology. The scale originated at NASA in the 1970s and was formalised as nine levels in the 1990s; it has since been adopted by the US Department of Defense, the European Commission (including Horizon 2020 and Horizon Europe), and as an international standard for space systems (ISO 16290). Each level describes the evidence that exists: from basic principles observed (TRL 1), through lab validation (TRL 4) and demonstration in a relevant environment (TRL 6), to a system proven in operation (TRL 9).
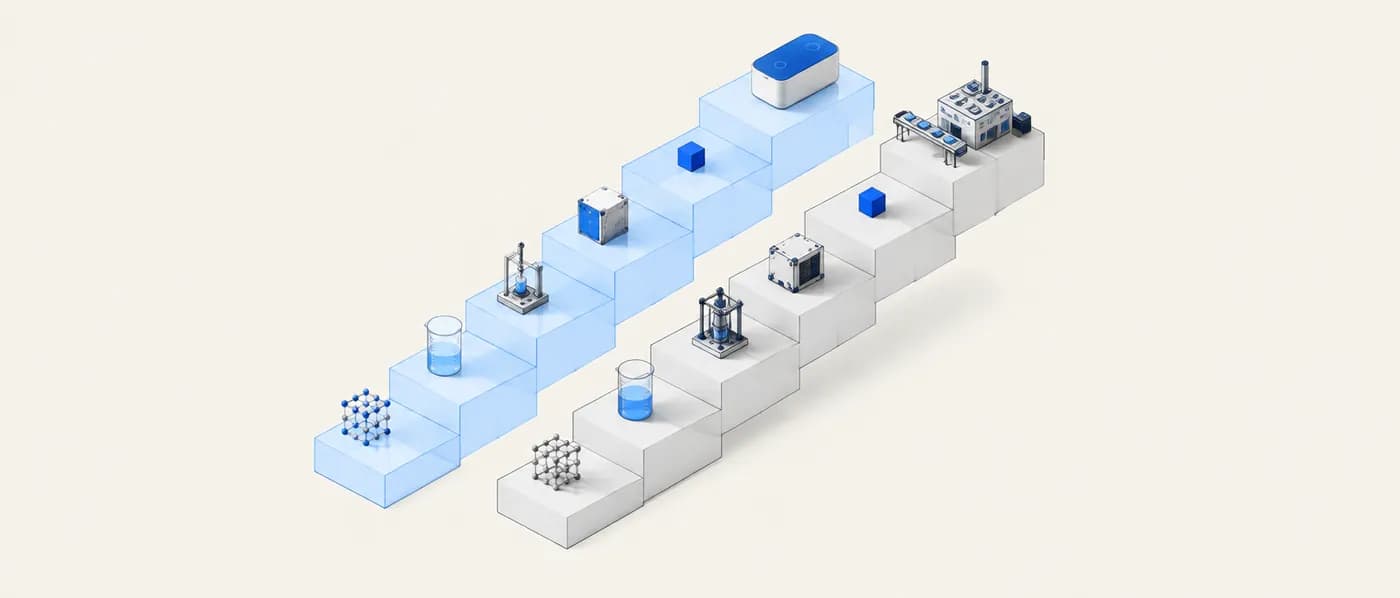
Manufacturing Readiness Levels (MRLs) were developed by the US Department of Defense to complement TRLs. They describe whether a technology can be produced: from basic manufacturing implications identified (MRL 1), through the capability to produce prototypes in a production-relevant environment (MRL 6) and a demonstrated pilot line (MRL 8), to full-rate production (MRL 10). A material can have a high TRL — it performs well in a device — and a low MRL — nobody can yet make it reproducibly at scale.
Both scales were designed for systems rather than materials, so applying them to a new compound or process needs judgement. The useful habit is to tie each level to evidence: what has been made, at what scale, tested under what conditions, by whom.
Why it matters for R&D decisions
Most disagreements about whether something is “ready” are disagreements about evidence. A shared readiness scale makes those conversations specific: a DFT-predicted phase, a 1-gram lab batch and a pilot-line material are different propositions with different risks and costs. Readiness levels also help planning — the work, people and money needed to move from TRL 3 to 4 are very different from TRL 6 to 7 — and they set honest expectations with customers and investors.
How to apply it, step by step
- 1Define what “the technology” is
Be explicit about the unit being assessed: a material, a material in a component (an electrode, a coating), or a full system (a cell, a reactor). The same material can be TRL 5 as a powder and TRL 3 in a new cell format.
- 2Define the operational environment
Write down the conditions the technology must ultimately survive — temperature, cycling, chemistry, duty cycle, lifetime. “Relevant environment” at TRL 5–6 is meaningful only against this definition.
- 3Assess against evidence, not plans
Assign the highest level for which the required evidence already exists. Planned tests, simulations of future tests and supplier claims without data do not count.
- 4Assess manufacturing separately
Rate MRL alongside TRL: batch size achieved, reproducibility, yield, process control, availability of precursors and equipment. A gap between TRL and MRL is a planning signal.
- 5Identify the next level’s evidence
For each technology, list the specific experiment or demonstration that would justify the next level, its cost and its duration. That list becomes the development plan.
- 6Re-assess at every gate
Readiness can go down as well as up — for example, if a new operating requirement appears or a scale-up batch fails to reproduce lab results.
Worked examples
A new sulfide solid electrolyte
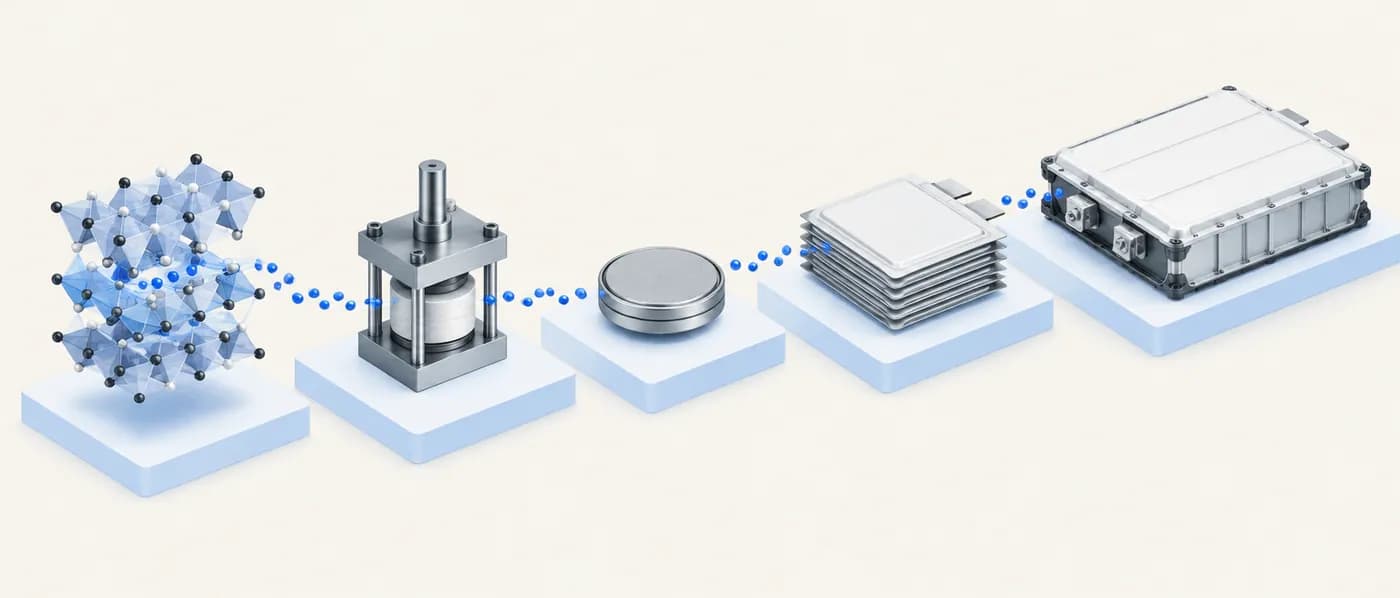
A team is assessing a solid electrolyte for all-solid-state lithium batteries. The operational environment is an automotive cell: room-temperature to elevated-temperature operation over many hundreds of cycles.
- 01Computational screening predicts a stable phase with a low lithium-migration barrier → TRL 1–2 (principles observed, concept formulated).
- 02A small batch is synthesised and ionic conductivity is measured by impedance spectroscopy on a pressed pellet → TRL 3 (experimental proof of concept).
- 03The electrolyte is integrated into lab-scale cells with a real cathode and anode and cycled under controlled conditions → TRL 4 (validated in the lab).
- 04Multilayer pouch cells are built and tested under conditions representative of the target application → TRL 5–6, depending on how representative the cells and tests are.
- 05Cells from a pilot line are tested by a customer in their application → TRL 7 and above.
A strong computational result is a starting point, not a validation. Each step to the next level needs a specific, often expensive, demonstration.
Checking a supplier’s “TRL 6” claim
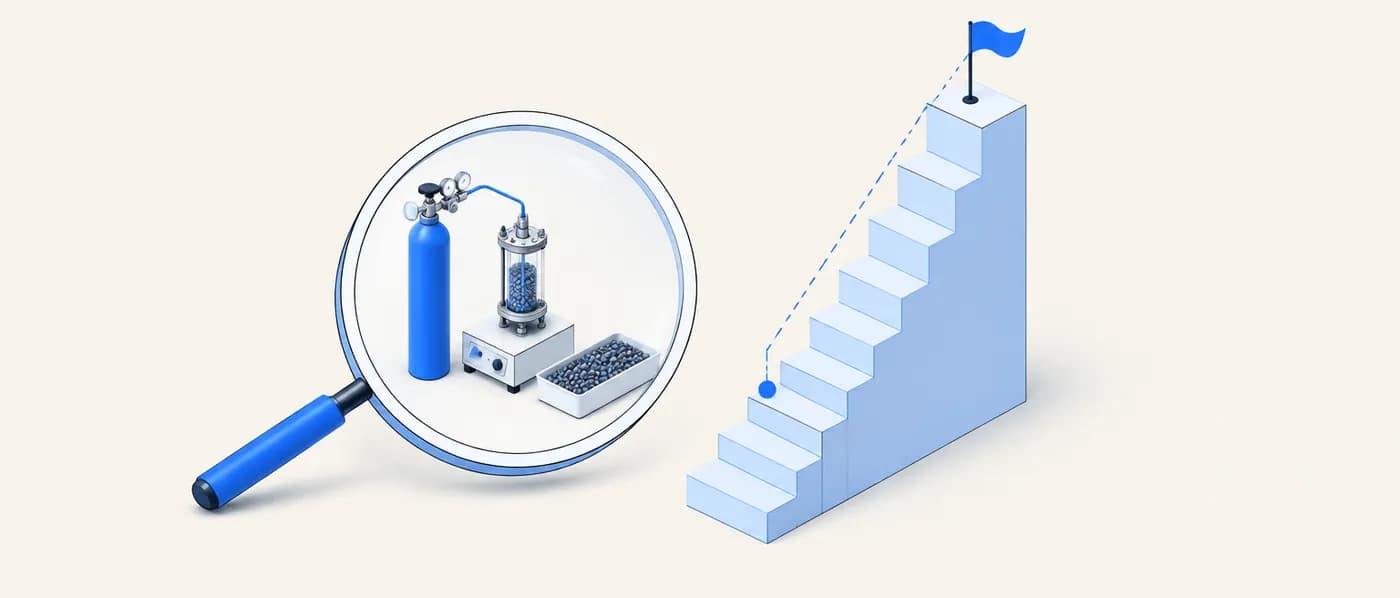
A catalyst supplier describes a new coated catalyst as TRL 6. Before relying on it, you ask what evidence supports the claim.
- 01Ask: what is the assessed unit — catalyst powder, coated substrate or full reactor?
- 02Ask: what was the relevant environment — real feedstock with impurities at operating temperature, or clean model gas?
- 03Ask: what scale — a few grams in a lab reactor or a full-size module?
- 04Ask: for how long — hours, or a duration that reveals deactivation?
- 05If testing used clean model gas in a lab reactor for tens of hours, the evidence supports roughly TRL 4, not TRL 6.
Always map a readiness claim to its evidence. The questions above apply to any supplier, partner or internal team.
High TRL, low MRL: a cathode scale-up
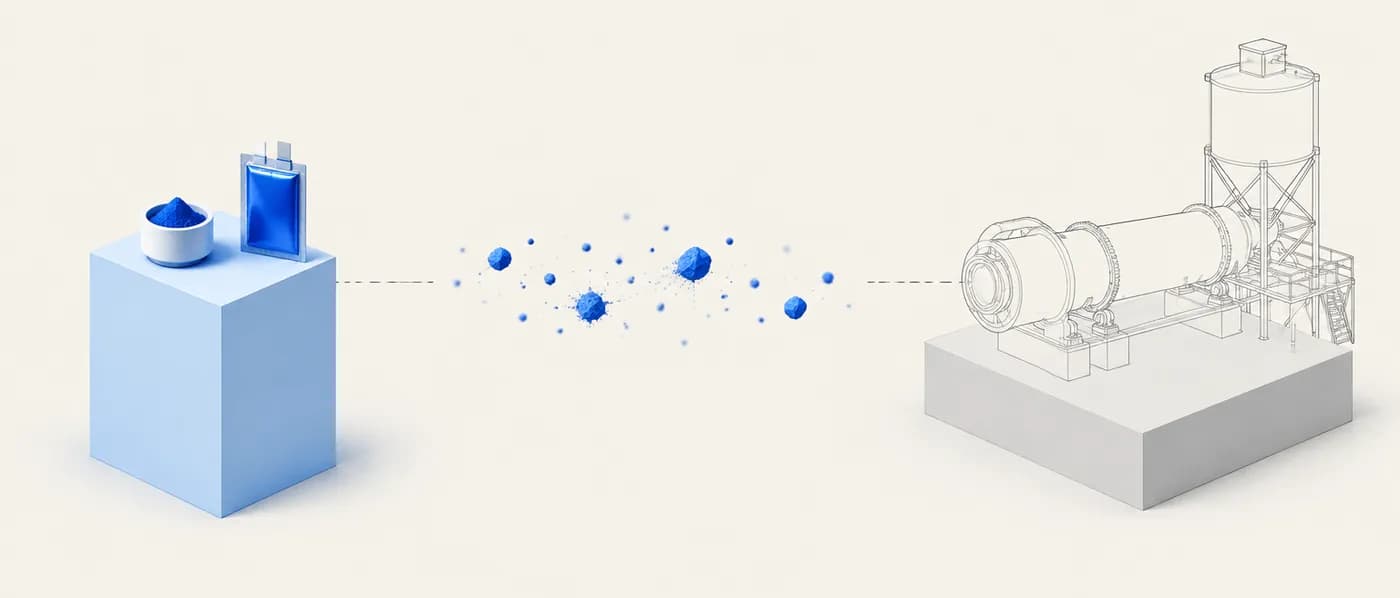
A modified cathode material performs well in customer-tested cells built from carefully made lab batches (strong TRL evidence), but every batch so far has been under 1 kg.
- 01Technology readiness: performance demonstrated in representative cells → TRL 5–6.
- 02Manufacturing readiness: capability to produce the material in a laboratory environment, but no production-representative process yet → about MRL 4.
- 03Gap: particle size, coating uniformity and impurity levels are unknown at larger batch sizes.
- 04Next evidence for MRL: a production-representative process at a larger batch size with documented reproducibility and yield.
Report TRL and MRL together. Many material programmes stall on manufacturing, not performance.
Technology Readiness Levels (abbreviated from the European Commission Horizon 2020 definitions)
| TRL | Definition | Typical evidence for a new material |
|---|---|---|
| 1 | Basic principles observed | Computational prediction, literature observation |
| 2 | Technology concept formulated | Proposed application and mechanism, supported by calculations |
| 3 | Experimental proof of concept | Material synthesised; key property measured in the lab |
| 4 | Technology validated in lab | Material works in a lab-scale component or cell |
| 5 | Technology validated in relevant environment | Component tested under conditions representative of the application |
| 6 | Technology demonstrated in relevant environment | Prototype-scale component or device demonstrated under representative conditions |
| 7 | System prototype demonstration in operational environment | Prototype tested in the real application, e.g. by a customer |
| 8 | System complete and qualified | Product qualified against specifications |
| 9 | Actual system proven in operational environment | In commercial or operational use |
When to use it — and when not to
- When comparing technologies or materials at very different stages of development.
- When planning budgets and timelines for development — each level transition implies specific work.
- When communicating with customers, investors, grant agencies or partners who expect TRL language.
- When assessing a supplier’s, partner’s or start-up’s maturity claims.
- As a measure of quality or promise: a TRL 2 idea can be more valuable than a TRL 7 product.
- As a substitute for detailed technical risk assessment; a level summarises evidence but doesn’t list what could fail.
- Without first defining the assessed unit and operational environment — otherwise the level is ambiguous.
Common mistakes
Applying it in Lattice Graph
Use LatticeGraph to establish what evidence exists for a candidate — computed, experimental or device-level — which is the starting point for an honest readiness assessment.
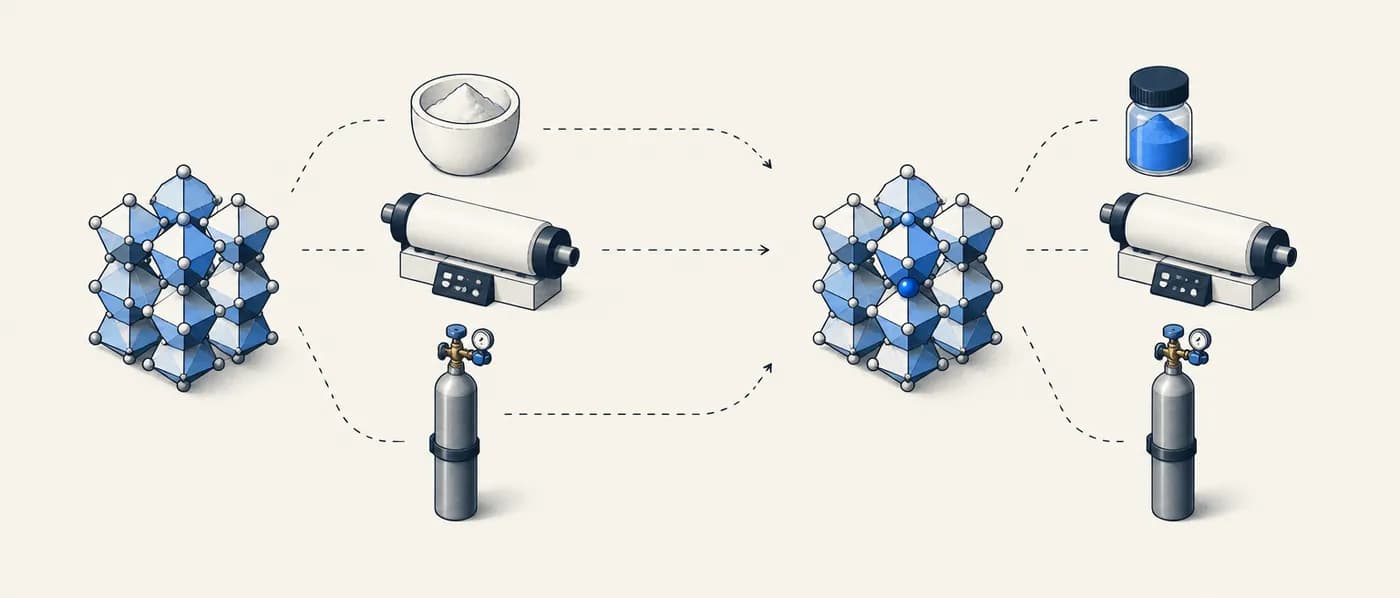
- 01Check whether the candidate has only computed entries or also experimental structures and measured properties; computed-only candidates sit at TRL 1–2.
- 02Look for synthesis recipes and device-level data (for example, cycling data for battery materials) as evidence for higher levels.
- 03Record the evidence tier for each claim in your evidence pack, so the readiness level can be traced back to sources.
Frequently asked questions
Who created the TRL scale?
TRLs originated at NASA in the 1970s. John Mankins’s 1995 NASA white paper set out the nine-level definitions that are widely used today, and the scale has since been adopted by the US Department of Defense, the European Commission and others.
What is the difference between TRL and MRL?
TRL describes how mature the technology is in terms of performance and demonstration. MRL, developed by the US Department of Defense, describes how mature the ability to manufacture it is. Both are needed for a product decision.
What is the “valley of death”?
An informal term for the gap between research funding and commercial investment, often placed around TRL 4–7, where costs rise sharply and many technologies stall.
Can a material have a TRL on its own?
Yes, if you define the assessed unit and environment clearly. Many teams assess the material in the context of its first intended component, such as a cathode in a specific cell format.
References & further reading
- [1]Mankins, J. C. (1995). Technology Readiness Levels: A White Paper. NASA Office of Space Access and Technology.Widely cited source of the nine-level TRL definitions.
- [2]European Commission (2014). Horizon 2020 – Work Programme 2014–2015, General Annexes, Annex G: Technology Readiness Levels.The TRL wording used in the reference table.
- [3]ISO 16290:2013. Space systems — Definition of the Technology Readiness Levels (TRLs) and their criteria of assessment.International standard version of the TRL scale.
- [4]US Department of Defense. Manufacturing Readiness Level (MRL) Deskbook. OSD Manufacturing Technology Program (various editions).Definitions and assessment criteria for MRL 1–10.
- [5]Mankins, J. C. (2009). Technology readiness assessments: A retrospective. Acta Astronautica, 65(9–10), 1216–1223.History of the TRL scale and its use.