What it is
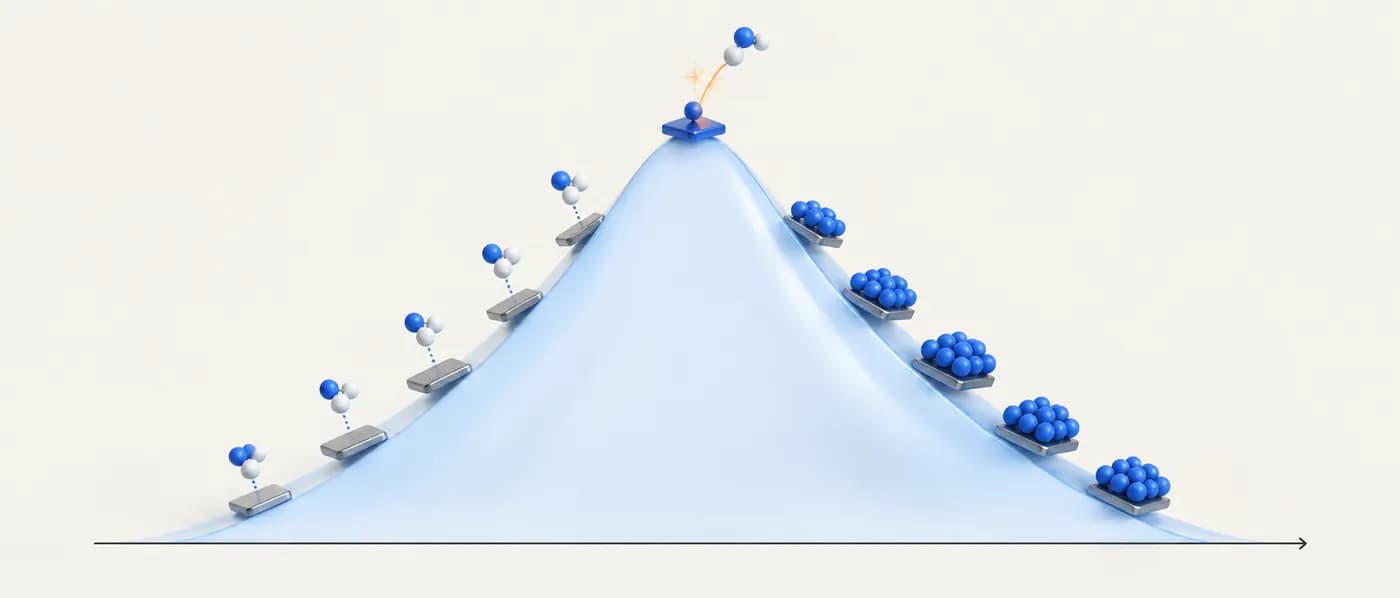
The Sabatier principle, named after Paul Sabatier, says that a good catalyst must interact with reactants strongly enough to activate them but weakly enough to release the products. If an intermediate binds too weakly, it never forms on the surface in useful amounts. If it binds too strongly, it sits on the active sites and blocks the next turnover.
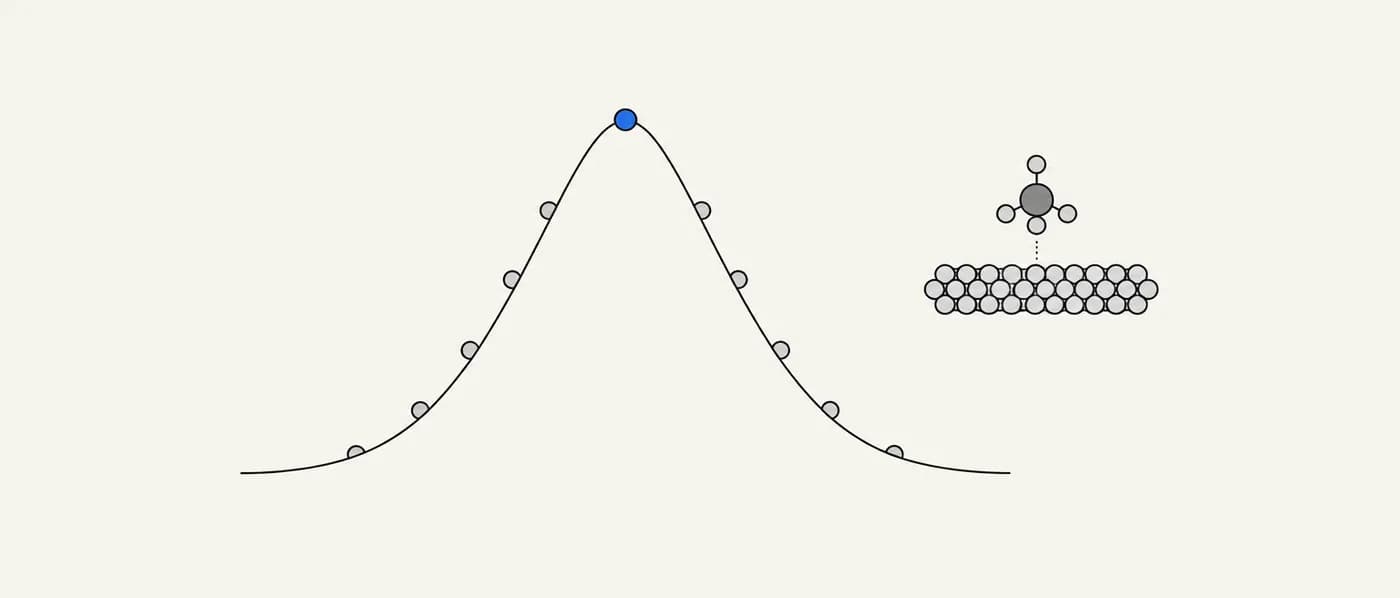
Modern computational catalysis makes this quantitative with descriptors: one or two adsorption energies (for example of H, O, OH or CO) that correlate with the barriers and free energies of the whole mechanism. Plotting measured or modelled activity against a descriptor across many catalysts gives a characteristic volcano shape. The apex marks the optimal binding strength, and the slopes on either side show which step limits the rate.
The d-band model, developed by Hammer and Nørskov, explains why transition metals differ in binding strength. The closer the centre of a metal’s d-states lies to the Fermi level, the more antibonding states are pushed above it and left empty, and the stronger the metal tends to bind adsorbates. Alloying, strain and ligand effects shift the d-band centre, which is why they can tune activity.
Why it matters for R&D decisions
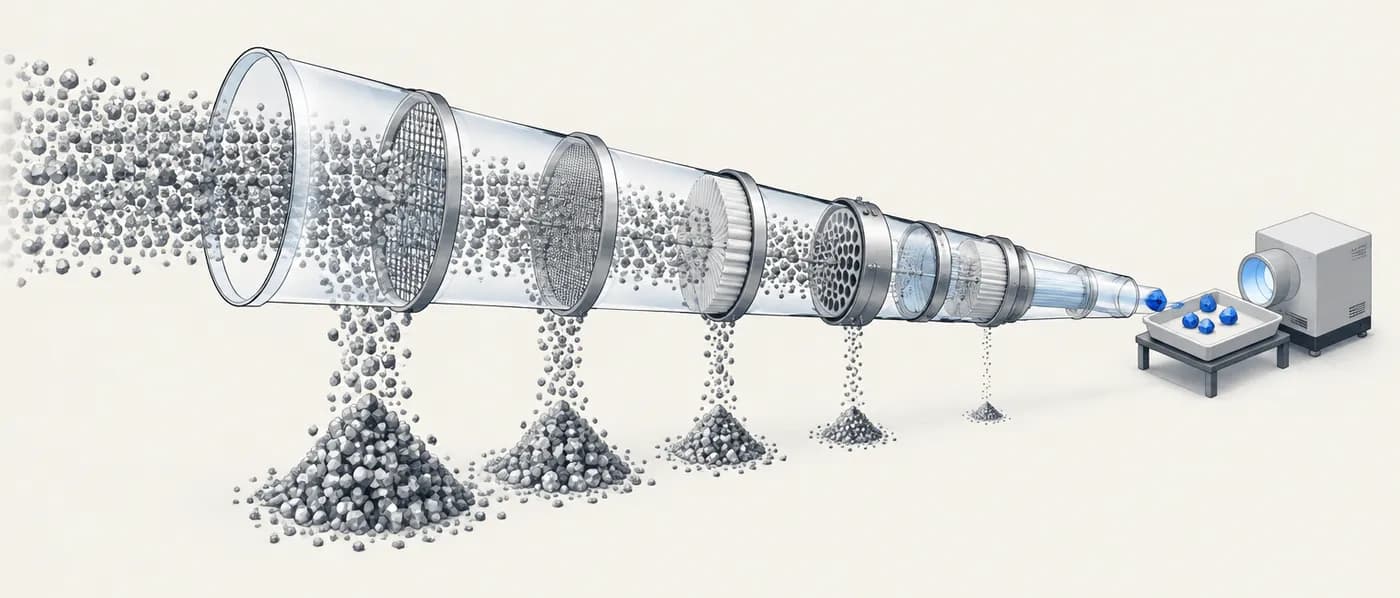
Screening thousands of catalyst compositions by computing full reaction mechanisms is expensive. Descriptor-based volcanoes let teams compute one or two adsorption energies per candidate, place it on a known volcano, and focus experiments on the few near the apex. The approach underlies most high-throughput catalyst discovery, from hydrogen evolution to oxygen reduction and ammonia synthesis.
The formula
ΔG_ads = ΔE_ads + ΔZPE − TΔS · HER optimum: ΔG_H* ≈ 0 eV · OER: η_theory = max(ΔG₁…ΔG₄)/e − 1.23 V
- ΔE_ads
- DFT adsorption energy of the intermediate relative to a gas-phase reference
- ΔZPE − TΔS
- Zero-point energy and entropy corrections (for H* Nørskov et al. used a combined ≈ +0.24 eV)
- ΔG_H*
- Free energy of adsorbed hydrogen, the descriptor for the hydrogen evolution reaction (HER)
- ΔG₁…ΔG₄
- Free-energy changes of the four proton–electron transfer steps in the oxygen evolution reaction (OER)
- 1.23 V
- Equilibrium potential of water oxidation; the four steps must sum to 4 × 1.23 = 4.92 eV
These are thermodynamic (computational hydrogen electrode) estimates. They predict trends, not absolute rates, and ignore kinetic barriers, solvation details and surface reconstruction under reaction conditions.
How to apply it, step by step
- 1Pick the reaction and its descriptor
Choose an established descriptor for your reaction: ΔG_H* for HER, ΔG_O* − ΔG_OH* for OER, O or OH binding for ORR, N binding for ammonia synthesis, CO binding for many CO₂-reduction routes. Use a descriptor the literature has validated against experiment.
- 2Compute or look up binding energies
Use consistent DFT settings (functional, slab model, coverage) for every candidate. Adsorption datasets such as the Open Catalyst Project and Catalysis-Hub provide many values, but only compare entries computed with matching settings.
- 3Place candidates on the volcano
Use a published volcano or one built from your own reference catalysts. Rank by distance from the apex, not by binding strength alone.
- 4Check which side of the peak you are on
Strong-binding side: the limiting step is desorbing or converting an over-bound intermediate. Weak-binding side: the limiting step is activating the reactant. This tells you which way to tune.
- 5Filter for stability
A candidate at the apex is useless if it dissolves, oxidises or reconstructs under operating conditions. Check Pourbaix stability and surface energies before ranking.
- 6Validate with experiment
Expect DFT errors of ~0.1–0.2 eV in adsorption energies, comparable to the width of a volcano peak. Test the top few candidates rather than trusting the exact rank order.
Worked examples
Hydrogen evolution: why platinum, and why MoS₂ edges
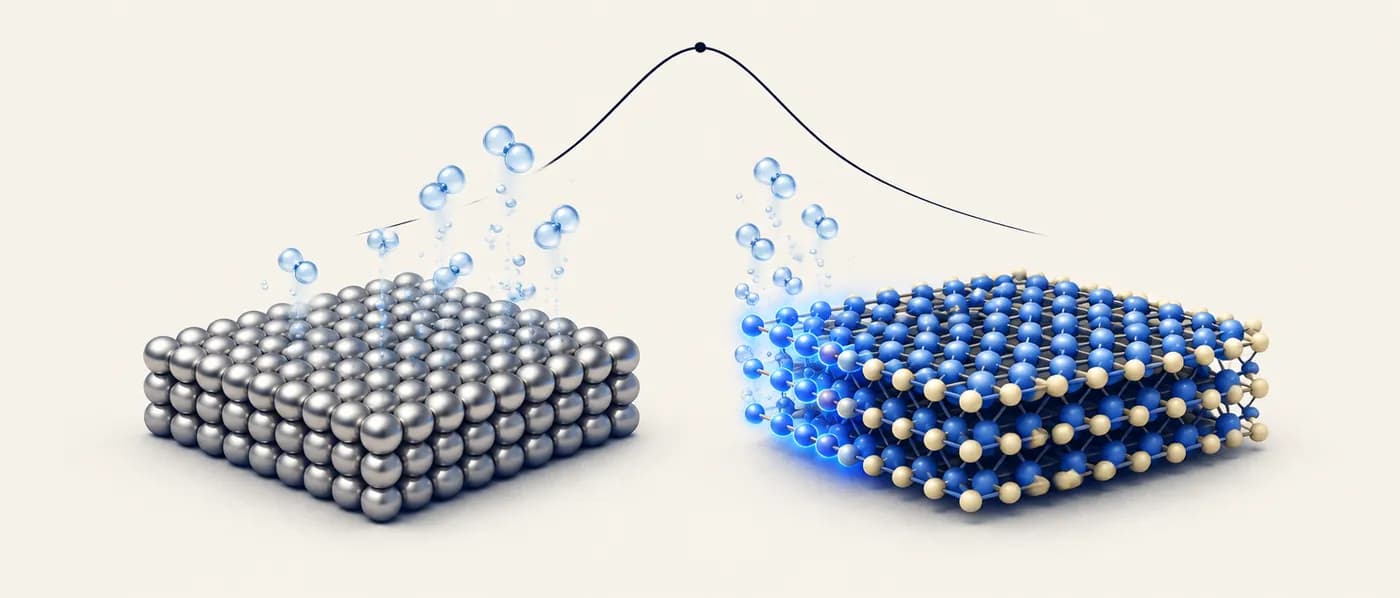
The HER volcano plots exchange current against the hydrogen-adsorption free energy ΔG_H*.
- 01Optimal HER activity requires ΔG_H* ≈ 0 eV: hydrogen binds just strongly enough to adsorb and just weakly enough to leave as H₂.
- 02Pt and other platinum-group metals sit close to ΔG_H* ≈ 0, which is why they top the volcano.
- 03Coinage metals such as Au bind hydrogen too weakly and fall on the weak-binding slope; early transition metals such as Mo and W bind too strongly.
- 04DFT predicted ΔG_H* ≈ 0.08 eV for the Mo edge sites of MoS₂ (Hinnemann et al., 2005), close to the apex.
- 05Jaramillo et al. (2007) confirmed that HER activity scales with the number of MoS₂ edge sites, not basal-plane area.
One well-chosen descriptor can surface a cheap alternative to a precious metal. The win came from engineering more edge sites, guided by where activity actually lives.
Why OER has a built-in overpotential floor
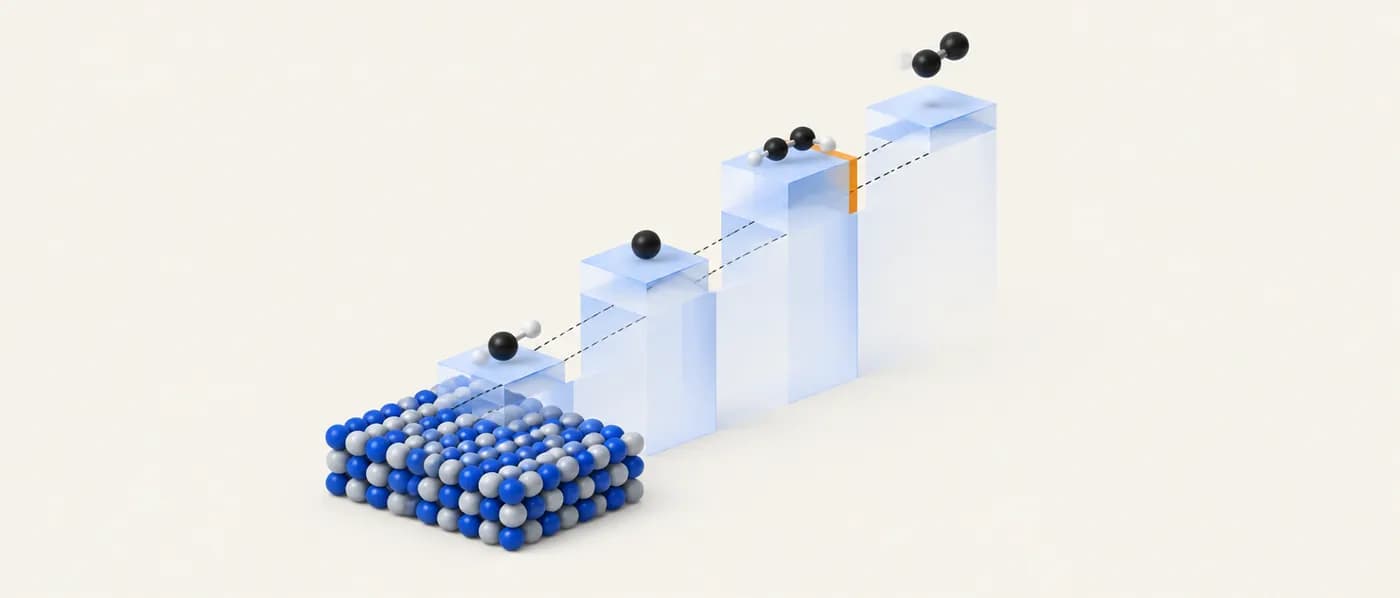
OER proceeds through four proton–electron steps via *OH, *O and *OOH. The binding energies of *OH and *OOH scale together.
- 01The four step free energies must sum to 4 × 1.23 = 4.92 eV.
- 02Man et al. (2011) found ΔG_OOH* − ΔG_OH* ≈ 3.2 eV across many oxide surfaces. This equals ΔG₂ + ΔG₃, the two middle steps.
- 03Best case: split 3.2 eV evenly → ΔG₂ = ΔG₃ = 1.60 eV. The remaining 1.72 eV covers steps 1 and 4 (e.g. 0.90 and 0.82 eV).
- 04Theoretical overpotential = max(ΔG)/e − 1.23 V = 1.60 − 1.23 = 0.37 V.
- 05No catalyst that obeys this scaling relation can do better than ~0.37 V in this model.
Scaling relations cap the volcano peak itself. Beating the cap means breaking the scaling, e.g. with a second binding site or a different mechanism, not just tuning binding strength.
Screening a set of alloy surfaces for HER (hypothetical)

A team has computed ΔG_H* for 40 bimetallic surfaces with consistent DFT settings and wants a shortlist.
- 01Rank surfaces by |ΔG_H*|. Keep those within ±0.15 eV of zero, about the DFT error bar.
- 02Remove alloys whose components dissolve at low pH or that have a positive energy of segregation for the active element.
- 03Check cost: drop anything relying heavily on platinum-group metals unless the activity gain is large.
- 04Send the 3–5 survivors to synthesis and measure exchange current density.
The volcano narrows the field. Stability and cost decide what goes into the lab.
Common descriptors by reaction
| Reaction | Typical descriptor | Where the optimum sits | Notes |
|---|---|---|---|
| Hydrogen evolution (HER) | ΔG_H* | ≈ 0 eV | Pt-group metals near the apex; MoS₂ edges close |
| Oxygen evolution (OER) | ΔG_O* − ΔG_OH* | Middle of the volcano | Scaling of *OOH vs *OH limits η to ≈ 0.37 V |
| Oxygen reduction (ORR) | ΔG_OH* or ΔE_O | Slightly weaker than Pt | Pt binds O/OH a little too strongly |
| Ammonia synthesis | N binding energy | Intermediate N binding | Ru and Os at the top of classic volcanoes; Fe close by |
| CO₂ reduction to C₂+ | CO binding energy | Intermediate CO binding | Cu is distinctive among pure metals |
When to use it — and when not to
- Screening many catalyst compositions with limited compute or lab time.
- Explaining why one catalyst outperforms another and which way to tune binding.
- Designing alloys, strained surfaces or single-atom sites to shift binding toward the apex.
- Sanity-checking activity claims against known trends.
- When the rate-limiting step is mass transport, electron transport or a kinetic barrier the descriptor does not capture.
- For surfaces that reconstruct, oxidise or dissolve under reaction conditions, unless the model uses the real working surface.
- To rank candidates whose descriptor values differ by less than the DFT error.
Common mistakes
Applying it in Lattice Graph
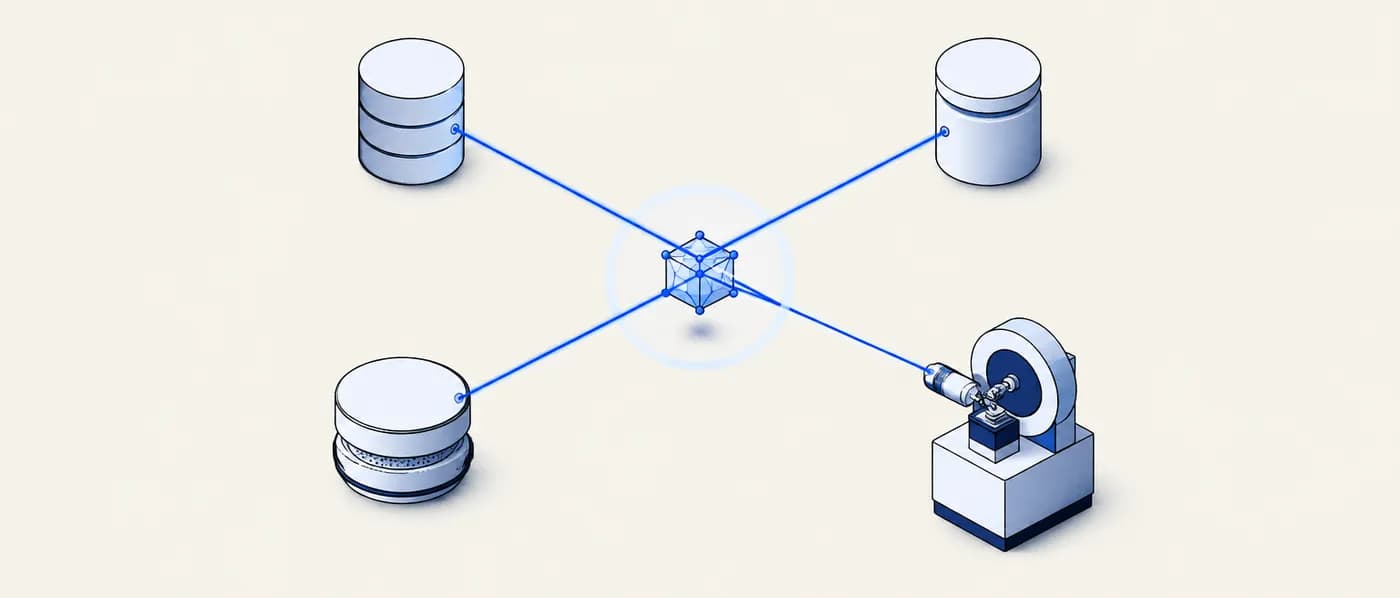
LatticeGraph’s catalyst workflow brings adsorption-energy datasets into the same search session as composition, stability and supply data.
- 01Search adsorption data by surface composition and adsorbate, then compare values only within a consistent source.
- 02Use stability and supply-risk data in the same session to filter apex candidates that would not survive or scale.
- 03Export the shortlist with provenance so the descriptor values, sources and assumptions travel with the recommendation.
Frequently asked questions
Why is it called a volcano plot?
Activity rises as binding strengthens from weak, peaks, then falls as binding becomes too strong. The two linear slopes meeting at a peak look like a volcano.
Is the d-band centre a reliable predictor?
It is a good trend predictor for transition-metal surfaces, especially for comparing related alloys or strained surfaces. It is less reliable for oxides, single-atom sites and systems where other electronic effects dominate.
What does ΔG_H* ≈ 0 actually mean?
The hydrogen intermediate is neither stabilised nor destabilised relative to H₂ at equilibrium potential, so both adsorption and desorption steps are thermoneutral and neither limits the rate in this simple model.
Can machine-learned potentials replace DFT for this?
They can pre-screen large spaces quickly, and datasets such as OC20 were built for exactly that. Confirm finalists with DFT and experiment, because ML errors can be similar to the width of the volcano peak.
References & further reading
- [1]Hammer, B. & Nørskov, J. K. (1995). Why gold is the noblest of all the metals. Nature, 376, 238–240.The d-band model applied to gold’s weak binding.
- [2]Hammer, B. & Nørskov, J. K. (2000). Theoretical surface science and catalysis—calculations and concepts. Advances in Catalysis, 45, 71–129.Review of the d-band model and descriptor-based catalysis.
- [3]Nørskov, J. K. et al. (2005). Trends in the exchange current for hydrogen evolution. Journal of the Electrochemical Society, 152(3), J23–J26.The HER volcano and the ΔG_H* descriptor.
- [4]Hinnemann, B. et al. (2005). Biomimetic hydrogen evolution: MoS₂ nanoparticles as catalyst for hydrogen evolution. Journal of the American Chemical Society, 127(15), 5308–5309.DFT prediction of near-optimal ΔG_H* at MoS₂ edges.
- [5]Jaramillo, T. F. et al. (2007). Identification of active edge sites for electrochemical H₂ evolution from MoS₂ nanocatalysts. Science, 317(5834), 100–102.Experimental confirmation that edges are the active sites.
- [6]Man, I. C. et al. (2011). Universality in oxygen evolution electrocatalysis on oxide surfaces. ChemCatChem, 3(7), 1159–1165.*OOH/*OH scaling and the ~0.37 V minimum theoretical OER overpotential.