What it is
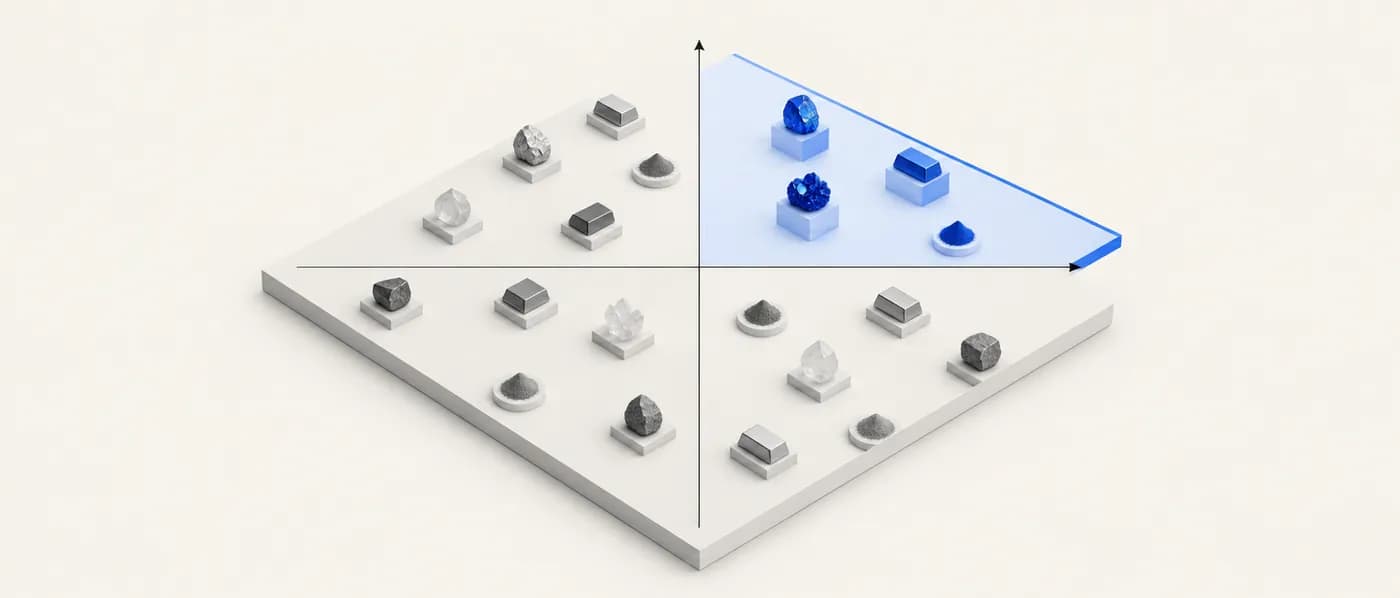
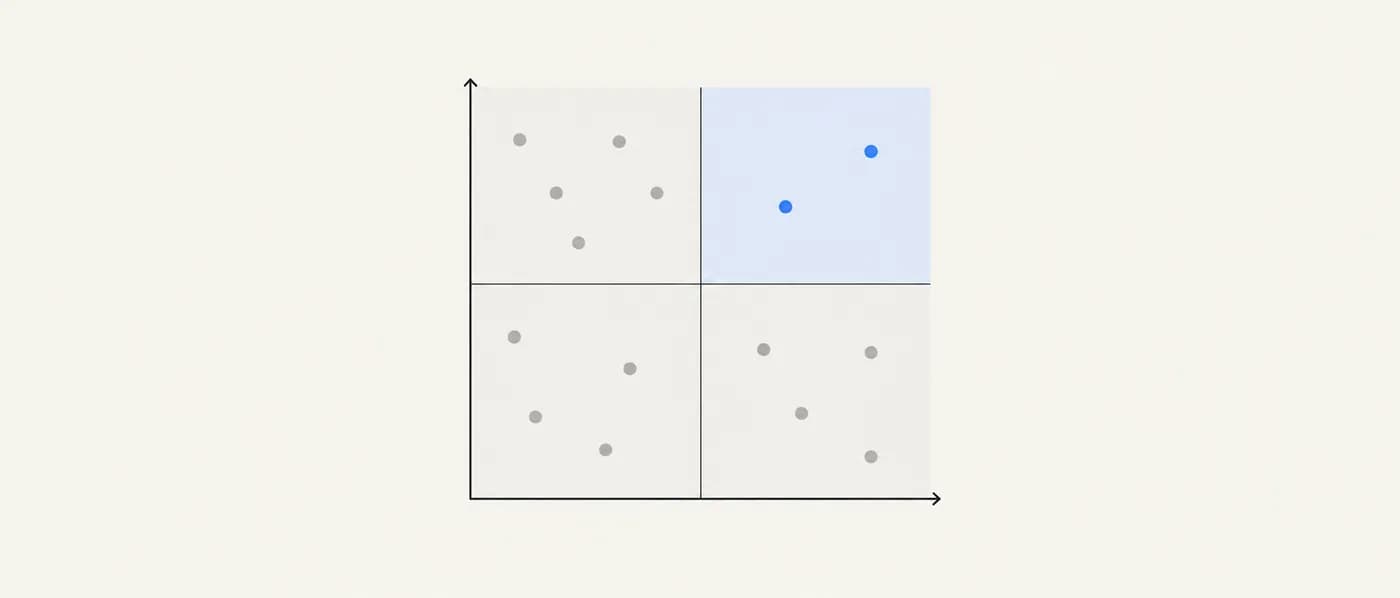
A criticality matrix is a two-dimensional screen for raw materials. One axis measures supply risk: how likely it is that supply will be restricted or become much more expensive. The other measures importance (also called vulnerability or economic importance): how badly a restriction would hurt the product, company or economy that depends on the material. Materials that score high on both are called critical.
The approach was popularised by the US National Research Council’s 2008 report Minerals, Critical Minerals, and the U.S. Economy, which plotted minerals on “impact of supply restriction” against “supply risk”. The European Commission adopted a quantitative version for its Critical Raw Materials (CRM) lists, first published in 2011 and revised every few years. It scores Economic Importance and Supply Risk and labels a material critical when both pass fixed thresholds. Graedel and colleagues at Yale extended the idea to three dimensions by adding environmental implications.
For an R&D team, the matrix is not a national policy instrument but a screening tool. You apply it to the elements in a candidate formula and to key processing inputs (precursors, solvents, catalysts). The question is simple: if we choose this material, which inputs could stop the line or wreck the cost model, and do we have a substitute?
Why it matters for R&D decisions
Materials decisions lock in supply chains for years. A cathode, catalyst or semiconductor that depends on a concentrated, export-controlled or by-product element can perform perfectly in the lab and still fail commercially. Gallium and germanium export restrictions from China in 2023, and recurring price spikes in cobalt, are reminders that supply risk can change faster than a product development cycle. Screening for criticality at the shortlist stage costs little and avoids designing around an input you cannot secure.
The formula
Critical if SR ≥ SR_threshold AND I ≥ I_threshold (EU CRM: SR ≥ 1.0 and EI ≥ 2.8)
- SR
- Supply risk score. In the EU method it combines supply concentration (an HHI of producing countries, weighted by governance quality), import reliance, end-of-life recycling input rate and substitutability.
- I / EI
- Importance or Economic Importance. In the EU method it reflects the value added of the end-use sectors that rely on the material, adjusted for substitution.
- thresholds
- Cut-offs set by the assessing body. Your internal matrix can use your own scales and thresholds.
There is no single universal formula. The EU, US and corporate methods differ in indicators, weighting and thresholds. The structure (two axes, high-high = critical) is what they share.
How to apply it, step by step
- 1List every input, not just the headline element
Break the candidate into elements and key process inputs: dopants, precursors, solvents, catalysts used in synthesis, and substrates. A cathode that is “cobalt-free” can still depend on a critical binder solvent or a concentrated precursor.
- 2Score supply risk
Use indicators you can source: production concentration by country (HHI), share from countries with export restrictions or weak governance, whether the element is mainly a by-product of another metal (which limits supply response), recycling rate, and price volatility. Official lists give a quick first pass.
- 3Score importance to your product
Ask how much of product value or performance depends on the input, how much you need per unit, and whether a substitute exists at acceptable performance. A trace dopant at 0.1 at% may matter less than a major constituent, unless no substitute exists.
- 4Plot and set thresholds
Place each input on the two axes. Agree thresholds before plotting so the result is not argued after the fact. Top-right means critical, top-left means watch (risky but substitutable), bottom-right means important but secure.
- 5Attach an action to every critical input
For each critical input record a mitigation: an alternative composition, a second supplier or region, recycling feedstock, inventory, or a decision to accept the risk. An unmitigated critical input is a gate blocker.
- 6Re-run on a schedule
Lists and markets change. Re-score at each stage gate and whenever there is a policy change, such as new export controls or a list revision.
Worked examples
Screening cathode elements for a new cell programme
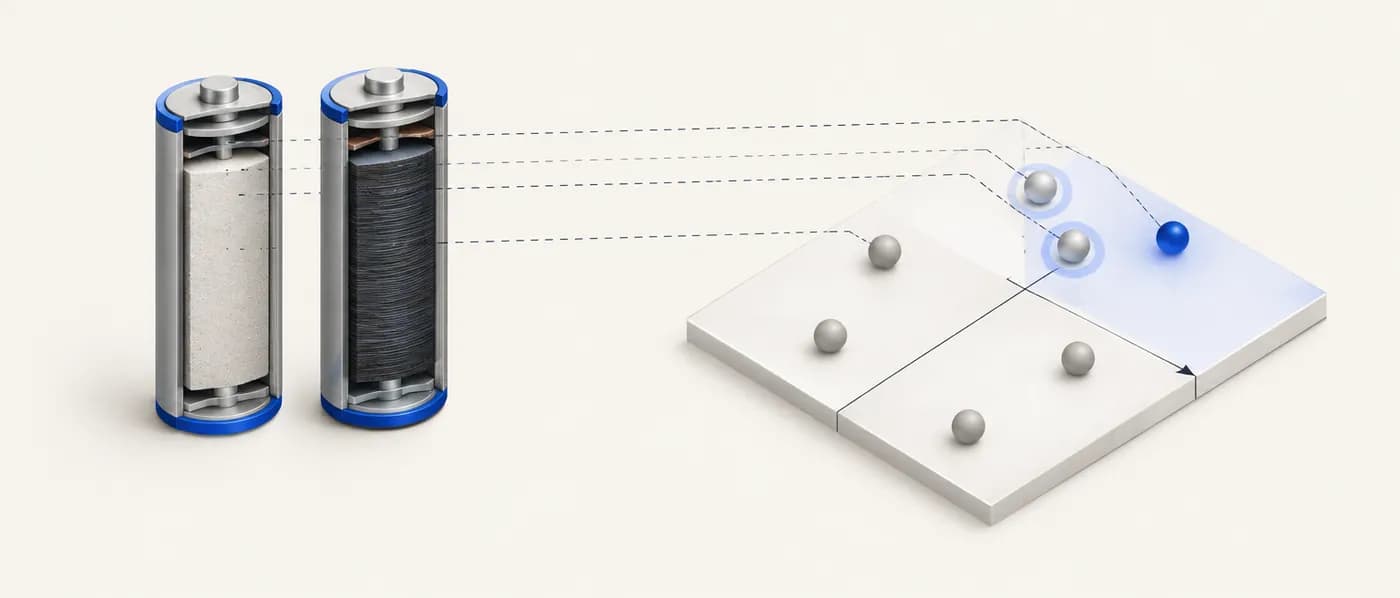
A team compares LiFePO₄ (LFP) and a nickel-rich NMC cathode and wants to know which elements need a mitigation plan. Scores below are illustrative 1–5 internal scores, not official values.
- 01List elements: LFP → Li, Fe, P. NMC → Li, Ni, Mn, Co.
- 02Score supply risk (illustrative): Co 5 (highly concentrated mining, by-product supply), Li 3, Ni 3, Mn 2, P 2, Fe 1.
- 03Score importance to this product (illustrative): Li 5 and Co 4 (no drop-in substitutes at the same performance), Ni 4, P 3, Mn 3, Fe 3.
- 04Apply a threshold of ≥ 4 on both axes: Co (5, 4) is critical. Li (3, 5) and Ni (3, 4) sit just below the supply-risk cut-off, so they go on a watch list.
- 05Check official lists as a cross-check: the EU 2023 list includes cobalt, lithium and phosphate rock, so LFP is not risk-free either.
The matrix doesn’t pick the chemistry. It tells you which inputs need a supply plan, and it can surface less obvious ones (phosphate) that a quick “avoid cobalt” rule would miss.
A power-electronics material that depends on gallium
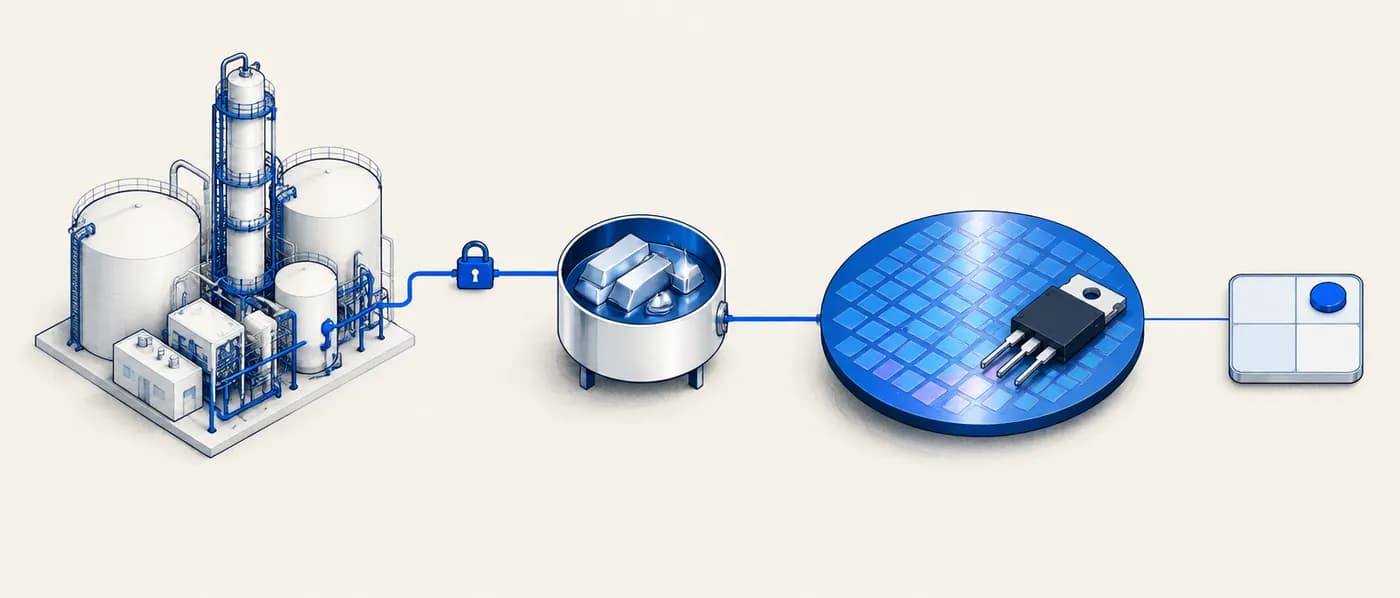
A semiconductor team is evaluating GaN and Ga₂O₃ device materials. Both depend on gallium, which is recovered mainly as a by-product of alumina (bauxite) refining.
- 01Supply risk: primary gallium production is highly concentrated in China, and China introduced export licensing for gallium and germanium products from 1 August 2023. By-product supply responds slowly to demand. Score: high.
- 02Importance: gallium is the defining element of the device material, so no substitution is possible within this design. Score: high.
- 03Result: critical. Mitigation options include qualifying non-Chinese refined gallium sources, recycling scrap from wafer and epitaxy processes, and holding inventory.
- 04Record the decision in the gate document with the chosen mitigation and an owner.
Being critical is not a veto. It is a requirement to plan. Some of the most valuable materials are critical by nature.
Iridium in PEM electrolyser anodes
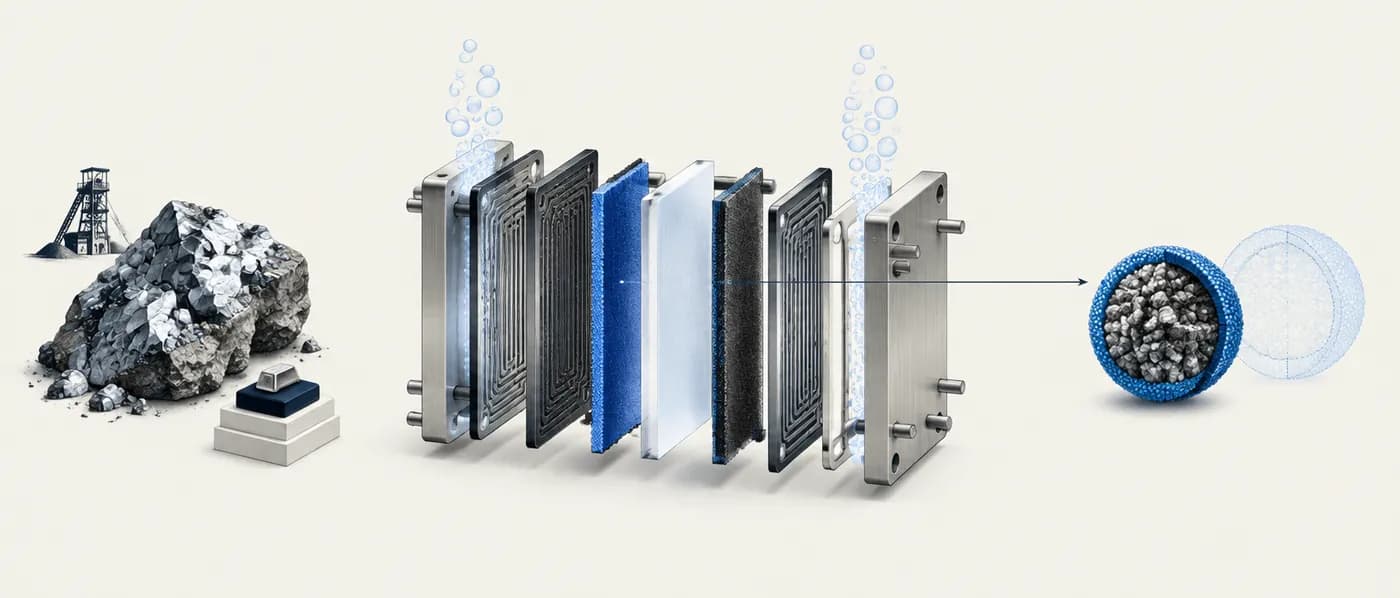
A catalyst team is choosing an oxygen-evolution catalyst for proton-exchange-membrane (PEM) water electrolysers, where iridium oxide is the incumbent.
- 01Supply risk: iridium is a platinum-group metal mined mainly as a by-product of platinum mining, largely in South Africa. Annual supply is very small, measured in single-digit tonnes. Score: high.
- 02Importance: iridium is the active phase in the incumbent anode, and acid-stable substitutes with comparable activity are still at research stage. Score: high.
- 03Result: critical. The matrix points R&D at two levers: reduce iridium loading per watt, and search for acid-stable, low-iridium or iridium-free catalysts.
- 04Use the criticality result to justify the research programme, and pair it with a cost model to quantify the benefit of lower loading.
A criticality matrix can set research targets, not just filter candidates.
Reading the four quadrants
| Quadrant | Supply risk | Importance | What to do |
|---|---|---|---|
| Critical | High | High | Mitigation plan required before the gate: substitute, second source, recycling, or inventory. |
| Watch | High | Low | Monitor. Substitution is feasible, so keep the alternative qualified. |
| Strategic but secure | Low | High | Lock in supply contracts. Monitor for policy or market changes. |
| Low concern | Low | Low | No action beyond periodic review. |
When to use it — and when not to
- Shortlisting candidate compositions before committing lab or scale-up resources.
- Writing a stage-gate case where supply continuity is a gate criterion.
- Prioritising substitution research (for example, low-cobalt or low-iridium chemistries).
- Explaining raw-material risk to non-technical stakeholders with a single chart.
- As a price forecast. Criticality says risk is elevated; it doesn’t predict the price next quarter.
- As the only commercial screen. Combine it with cost, IP and life-cycle assessments.
- When the official list is used without checking your own volumes and substitutes. National importance and your product’s importance are different questions.
Common mistakes
Applying it in Lattice Graph
Use LatticeGraph to attach supply context to every candidate as it is shortlisted, so criticality is visible alongside performance and stability rather than discovered at the end.
- 01Search and shortlist candidates as usual, filtering out elements your team has already ruled out (for example, “no Co”).
- 02Open the supply-risk view for each shortlisted material to see element-level production concentration (HHI), top producer and share, and EU/US critical-list flags drawn from USGS Mineral Commodity Summaries data.
- 03Record a supply-risk and importance score for each input in your evidence pack, with the source and date of any official list you relied on. Note which list version the view uses, since lists are revised.
- 04Carry critical inputs and their mitigations into your stage-gate document.
Frequently asked questions
Is a material on the EU or US critical list a no-go?
No. Critical means supply risk and importance are both high, so you need a mitigation plan. Many valuable products depend on critical materials.
What is the difference between the EU and US approaches?
Both use two axes, but the indicators, data and thresholds differ. The EU scores Economic Importance and Supply Risk against fixed thresholds. The US list is maintained by the USGS under the Energy Act of 2020, and the Department of Energy runs a separate assessment focused on energy technologies. Results overlap but are not identical.
Should I score elements or compounds?
Score the elements and the specific intermediate products you buy (for example, a precursor salt or refined metal). Supply risk often sits at the intermediate, not the ore.
How often should we re-score?
At each stage gate, and whenever a relevant policy changes, such as new export controls or a list revision.
References & further reading
- [1]National Research Council (2008). Minerals, Critical Minerals, and the U.S. Economy. Washington, DC: The National Academies Press.Origin of the supply-risk vs impact matrix in its widely used form.
- [2]Graedel, T. E. et al. (2012). Methodology of Metal Criticality Determination. Environmental Science & Technology, 46(2), 1063–1070.Three-dimensional criticality: supply risk, environmental implications, vulnerability to supply restriction.
- [3]European Commission (2023). Study on the Critical Raw Materials for the EU 2023 – Final Report. Publications Office of the European Union.Current EU list and the Economic Importance / Supply Risk methodology.
- [4]U.S. Geological Survey (2025). Final 2025 List of Critical Minerals. Federal Register 90 FR 50494.Current US list of 60 critical minerals under the Energy Act of 2020. It replaced the 2022 list of 50 (87 FR 10381).
- [5]U.S. Department of Energy (2023). Critical Materials Assessment.Energy-technology-focused criticality assessment with short- and medium-term views.