What it is
Machine-learning models — graph neural networks, universal interatomic potentials, descriptor-based regressors — now predict formation energies, band gaps, elastic moduli and stabilities for materials that have never been calculated or made. Each model has been evaluated on a held-out test set, which gives an average error such as the mean absolute error (MAE), or a classification metric such as precision or hit rate for finding stable materials.
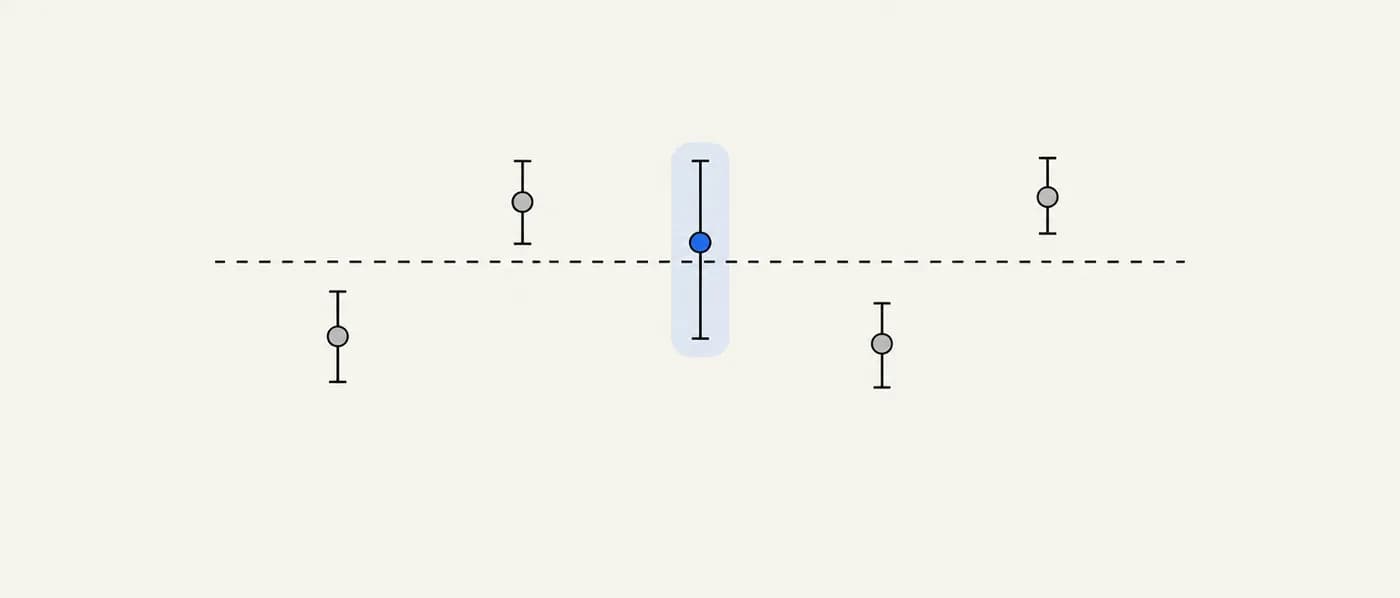
Knowing the model’s error means carrying that number alongside every prediction and asking a simple question: is the prediction far enough from my threshold that the model’s typical error could not flip the decision? If yes, the prediction is decision-grade for screening. If no, it is a hint that needs a higher-tier check.
Public benchmarks make this practical. Matbench provides standardised tasks for common properties with fixed train/test splits. Matbench Discovery evaluates how well models identify thermodynamically stable crystals in a prospective-style setting, reporting both regression errors and classification metrics.
Why it matters for R&D decisions
ML screening is cheap enough that teams can rank hundreds of thousands of candidates in hours. The risk is not that models are useless — many are very good — but that their predictions are read as exact. A ranked list looks equally confident at position 5 and position 500. Comparing each prediction with the model’s error is the step that separates ‘the model says so’ from ‘the model is accurate enough to say so here’.
The formula
decisive if |ŷ − threshold| > k × MAE; otherwise escalate to a higher-tier check
- ŷ
- The model’s predicted value for the candidate
- threshold
- Your go/no-go value for the property (e.g. 25 meV/atom above hull)
- MAE
- The model’s mean absolute error on a benchmark task for the same property
- k
- A safety factor you choose; 1–2 is common. Larger k means fewer false positives but more expensive follow-up
MAE is an average; individual errors can be several times larger. If the model provides calibrated uncertainties, use those per-prediction instead.
How to apply it, step by step
- 1Find the right benchmark number
Look up the model’s error on a benchmark for the same property and similar data. An MAE on formation energy does not tell you the error on energy above hull or on band gap.
- 2Define the decision margin
For each candidate, compute how far the prediction is from your threshold. A candidate predicted at 5 meV/atom above hull with a 25 meV/atom threshold has a 20 meV/atom margin.
- 3Compare margin with error
If the margin is comfortably larger than the model’s typical error, treat the prediction as decision-grade for screening. If not, escalate the candidate to DFT or experiment.
- 4Check whether the candidate is in-distribution
Errors grow for compositions, structure types or elements under-represented in the training data. A model trained mostly on oxides is less reliable on intermetallics or nitrides.
- 5Track hit rate, not just MAE, for discovery tasks
When the goal is to find stable materials, what matters is how many predicted-stable candidates are actually stable. A model can have a low MAE and still misclassify many materials near the hull.
Worked examples
Stability screen with a universal interatomic potential
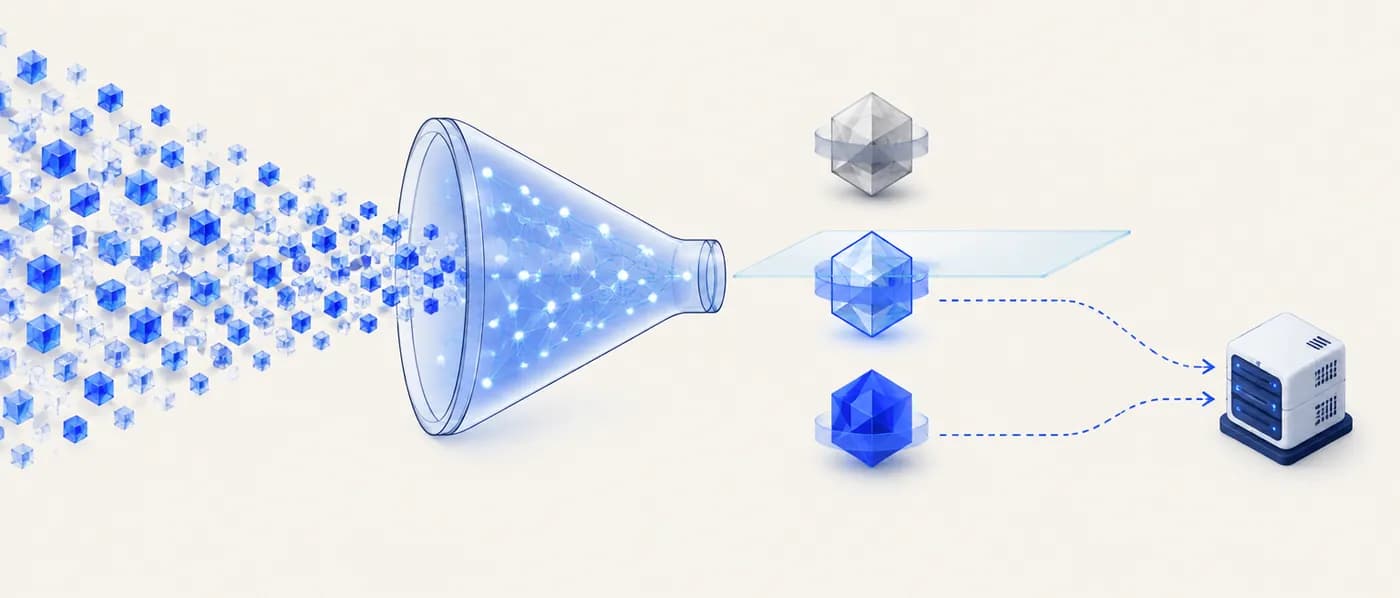
You use a universal ML potential to estimate energy above hull for 10,000 hypothetical compounds. Gate: ≤ 25 meV/atom. Suppose the model’s benchmark MAE on energy above hull is 30 meV/atom (hypothetical, but of the order reported for strong models).
- 01Candidate A: predicted 150 meV/atom. Margin = 150 − 25 = 125 meV/atom ≈ 4 × MAE. Reject with confidence.
- 02Candidate B: predicted 15 meV/atom. Margin = 25 − 15 = 10 meV/atom ≈ 0.3 × MAE. The model cannot decide.
- 03Candidate C: predicted −40 meV/atom (below the current hull). Margin = 65 meV/atom ≈ 2 × MAE. Promising, but a claim of a new stable phase needs DFT confirmation.
- 04Escalate B and C to DFT relaxation; skip A.
The same model is decisive for some candidates and useless for others; the margin decides which.
Why a small formation-energy error can still mislead on stability

A model predicts formation energies with an MAE of about 30 meV/atom. You want to use it to decide which compounds are on the convex hull.
- 01Stability is the difference between a compound’s energy and the energy of competing phases. Most of the formation energy cancels in that difference.
- 02In DFT, systematic errors partly cancel because the compound and its competitors are computed the same way. ML errors are less correlated between chemically similar compounds, so they cancel less.
- 03Typical decomposition energies of real materials are only tens of meV/atom, comparable to the model’s error.
- 04Result: classification of stable vs unstable can be much worse than the formation-energy MAE suggests.
Check the error of the quantity you decide on, not of the quantity the model was trained on.
Band gap model on an out-of-distribution class
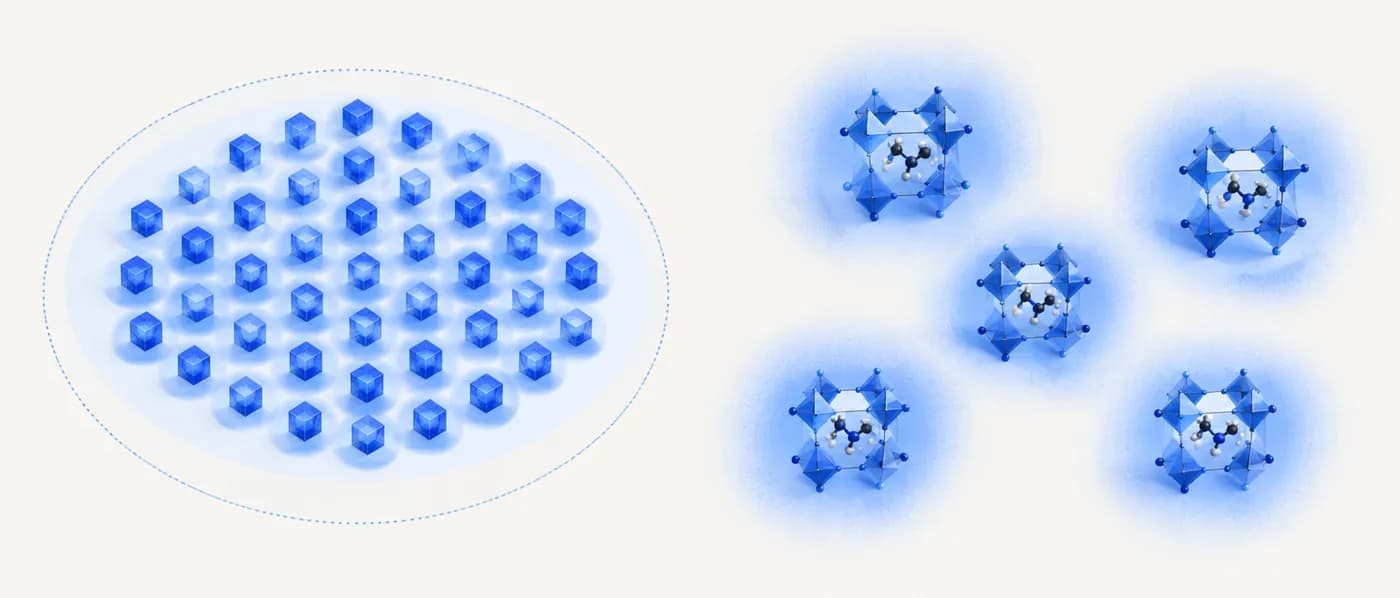
A band-gap model reports an MAE of 0.35 eV on its test set (hypothetical). You apply it to a family of hybrid organic–inorganic halides that make up a small fraction of the training data.
- 01Check training-data coverage: few examples of this structural family.
- 02Run the model on five halides with known experimental gaps; observed errors range from 0.2 to 0.9 eV (hypothetical).
- 03Mean absolute error on this family ≈ 0.5 eV, larger than the headline MAE.
- 04Use the family-specific error, not the headline number, for decisions on this class.
Headline benchmark errors are averages over the benchmark’s data; your chemistry may be harder.
Which error metric for which decision
| Decision | Metric to look up | Why |
|---|---|---|
| Rank candidates by a property | MAE / RMSE on that property | Tells you how much rank order can shuffle |
| Find thermodynamically stable materials | Precision, recall, F1 or discovery hit rate for stability | Stability is a classification near a threshold |
| Filter by a threshold | Error compared with margin to threshold | Only near-threshold candidates are at risk |
| Use on a new chemistry | Error on a held-out subset of similar chemistry | Errors grow out of distribution |
When to use it — and when not to
- Every time an ML prediction influences which candidates go forward.
- When choosing between models for a screening campaign.
- When presenting predicted properties to non-specialists.
- When deciding how many candidates to verify with DFT or experiment.
- As the only check for materials far outside the training data — measure or compute directly instead.
- As a substitute for physical constraints: a prediction inside the error bar can still be physically impossible (e.g. a negative band gap).
Common mistakes
Applying it in Lattice Graph
LatticeGraph includes Matbench and Matbench Discovery benchmark data alongside the computed sources models are trained on, so you can check a model’s reported error and compare predictions with DFT values for the same materials.
- 01Before acting on a predicted value, look up the relevant benchmark task and note the model’s error for that property.
- 02Compare the predicted value with your threshold and mark near-threshold candidates as provisional.
- 03Where a DFT value exists in Materials Project, OQMD, AFLOW or JARVIS for the same material, compare it with the prediction.
- 04Record the prediction, the model, and its benchmark error in your evidence pack.
Frequently asked questions
What is a ‘good’ MAE?
It depends entirely on your decision margin. An error of 30 meV/atom is excellent for rejecting compounds hundreds of meV above the hull and inadequate for deciding between two candidates 10 meV/atom apart.
Are per-prediction uncertainties better than benchmark MAE?
When they are calibrated, yes — they tell you which individual predictions are risky. Check the model’s calibration before relying on them.
Why does Matbench Discovery report classification metrics as well as errors?
Because discovering stable materials is a classification problem near a threshold. A model with modest energy errors can still have high or low hit rates depending on how its errors are distributed near the hull.
References & further reading
- [1]Dunn, A., Wang, Q., Ganose, A., Dopp, D., & Jain, A. (2020). Benchmarking materials property prediction methods: the Matbench test set and Automatminer reference algorithm. npj Computational Materials, 6, 138.Defines the Matbench tasks and evaluation protocol.
- [2]Riebesell, J., Goodall, R. E. A., Benner, P., Chiang, Y., Deng, B., Ceder, G., Asta, M., Lee, A. A., Jain, A., & Persson, K. A. (2025). A framework to evaluate machine learning crystal stability predictions. Nature Machine Intelligence, 7, 836–847.Matbench Discovery: prospective-style benchmark for ML stability prediction.
- [3]Bartel, C. J., Trewartha, A., Wang, Q., Dunn, A., Jain, A., & Ceder, G. (2020). A critical examination of compound stability predictions from machine-learned formation energies. npj Computational Materials, 6, 97.Shows that accurate formation energies do not guarantee accurate stability predictions.
- [4]Sun, W., Dacek, S. T., Ong, S. P., Hautier, G., Jain, A., Richards, W. D., Gamst, A. C., Persson, K. A., & Ceder, G. (2016). The thermodynamic scale of inorganic crystalline metastability. Science Advances, 2, e1600225.Shows that decomposition and metastability energies of real materials are typically tens of meV/atom.