What it is
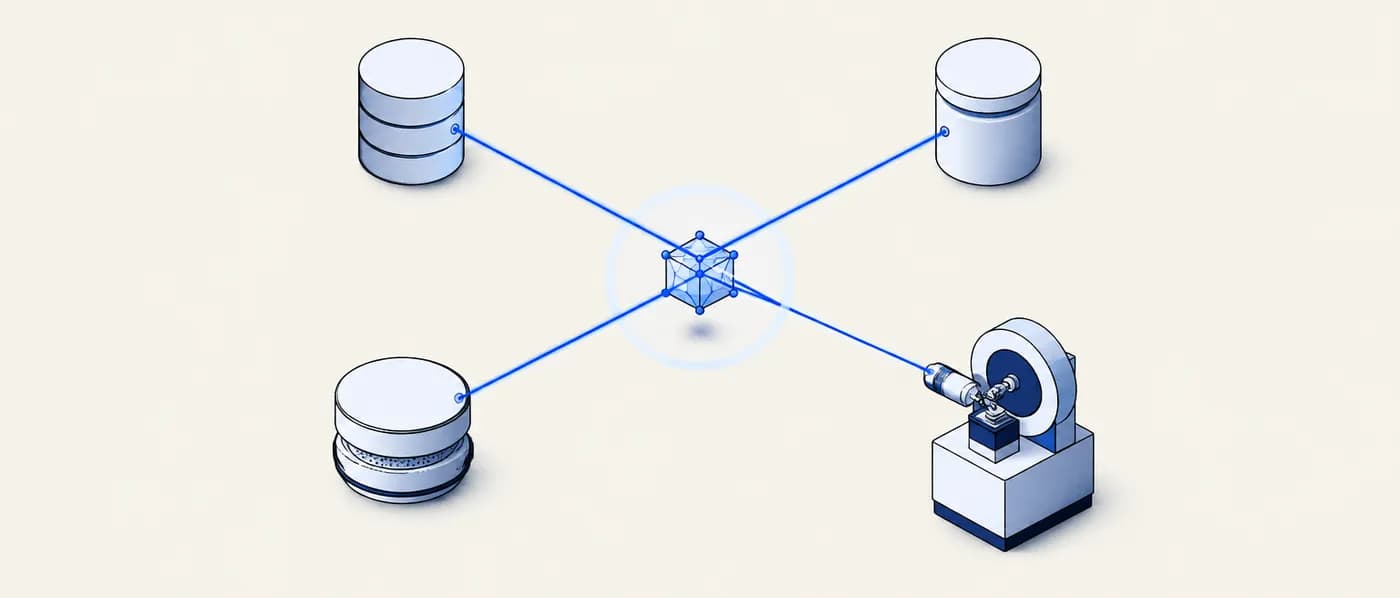
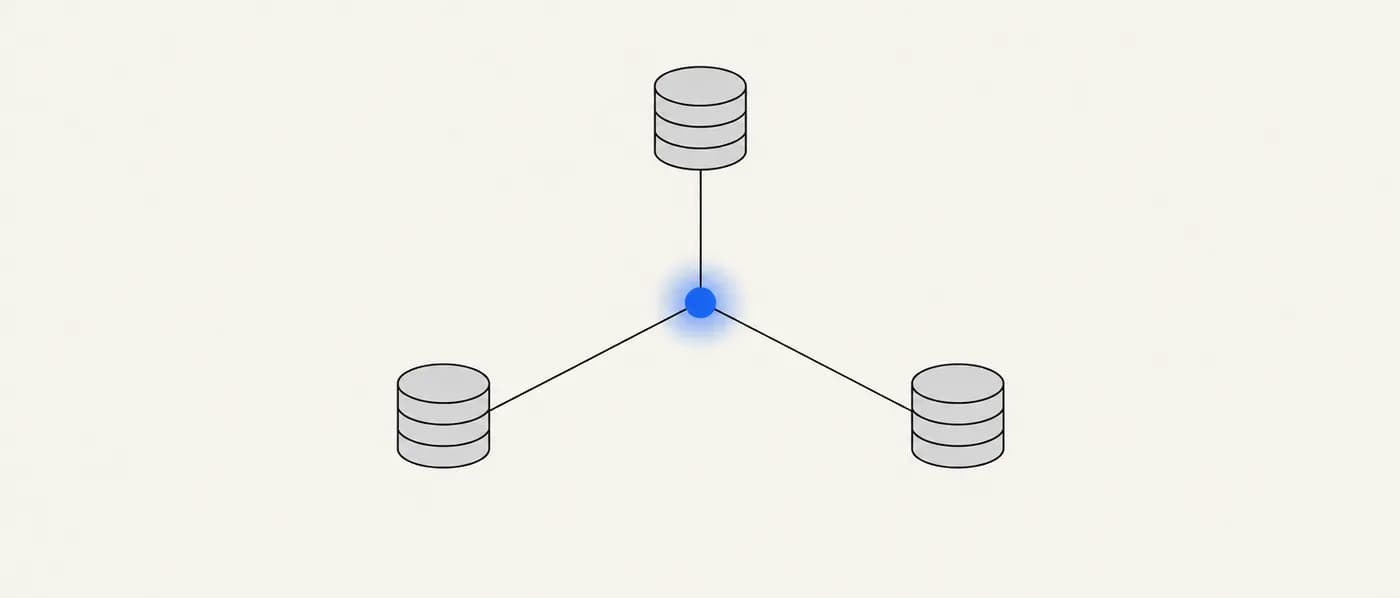
Triangulation is the habit of checking one value against several independent measurements or calculations of the same thing. In materials R&D it means looking up a formation energy, band gap, lattice parameter or conductivity in more than one database or paper, comparing them on a like-for-like basis, and only then deciding how much weight the number can bear.
The large computed databases — Materials Project, OQMD, AFLOW, JARVIS-DFT, Alexandria and others — overlap heavily in the compositions they cover, but they differ in DFT functional, pseudopotentials, Hubbard U values, energy correction schemes and the reference phases used to build convex hulls. Experimental sources such as crystal-structure databases and thermochemical tables are measured on real samples with their own uncertainties. Each source has a characteristic way of being wrong; triangulation uses that diversity to catch errors any single source would hide.
The output is not just an averaged value. It is a judgement: the sources agree within a stated spread, or they disagree and you know why, or they disagree and you do not yet know why — in which case the value is provisional.
Why it matters for R&D decisions
Early-stage materials decisions are often made on a single database number: a stability flag, a band gap, a predicted voltage. If that number is an artefact of one source’s settings, the error propagates into a synthesis campaign or a customer conversation. Checking two or three independent sources takes minutes and is the cheapest way to avoid spending weeks of lab time on a phase that only exists in one dataset’s calculations — or to discover that a ‘failed’ candidate was rejected because of one source’s quirk.
The formula
spread = max(xᵢ) − min(xᵢ); agreement if spread ≤ tolerance, where tolerance is set per property before comparing
- xᵢ
- The value of the same property for the same material and phase, from source i, after converting to common units and references
- spread
- Range across sources; a robust alternative is the median absolute deviation
- tolerance
- The disagreement you are willing to accept, chosen from the property’s known typical error and the size of your decision margin
There is no universal tolerance. A reasonable choice for DFT formation energies is a few tens of meV/atom; for band gaps compare only within the same level of theory, because functionals differ systematically.
How to apply it, step by step
- 1Fix what you are comparing
Write down the material, the specific phase (space group or structure prototype), the property, its units and its reference state. Many ‘disagreements’ are simply two sources reporting different polymorphs of the same formula.
- 2Collect values from independent sources
Pull the property from at least two computed sources and, where it exists, one experimental source. Note the method behind each value: functional, U correction, energy correction scheme, or measurement technique and temperature.
- 3Normalise before you compare
Convert units, align sign conventions and reference states, and make sure you are comparing like with like. For example, some databases report a signed stability where on-hull phases have negative values, while others report energy above hull clamped at zero.
- 4Set a tolerance before looking at the spread
Decide in advance how much disagreement is acceptable for this property and this decision. If your go/no-go threshold is 25 meV/atom, a 100 meV/atom spread between sources means the data cannot decide the question yet.
- 5Investigate outliers instead of averaging them
When one source sits far from the others, check the usual causes first: different polymorph, different magnetic configuration, different Hubbard U or correction scheme, or a different set of competing phases in the hull. Only exclude a value once you can name the reason.
- 6Record the verdict with its provenance
Report the agreed value or range, the sources used, the spread, and any outlier with its explanation. That record is what lets a colleague or reviewer trust the number without repeating the work.
Worked examples
Formation energy of a battery cathode candidate
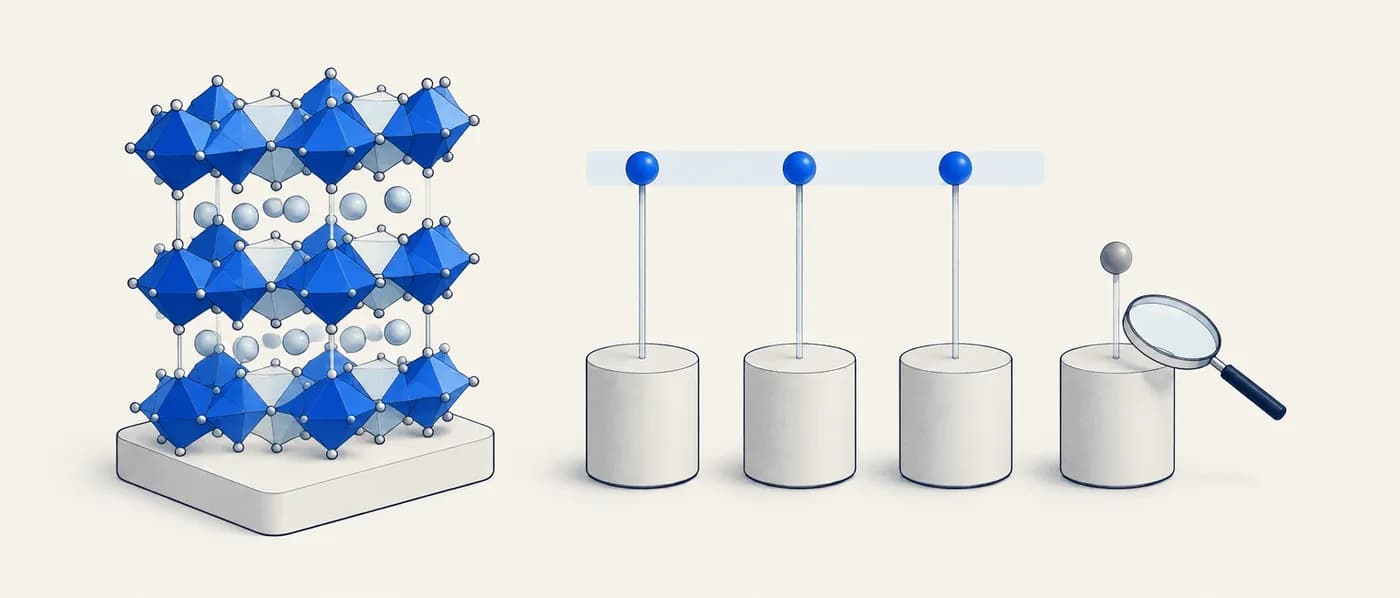
You are screening an olivine phosphate and need to know whether it is thermodynamically stable before proposing synthesis. The values below are hypothetical but representative of how computed databases compare.
- 01Collect formation energies for the same olivine structure: source A −2.27, source B −2.25, source C −2.29, source D −2.36 eV/atom (hypothetical).
- 02Spread of A–C = −2.25 − (−2.29) = 0.04 eV/atom, i.e. 40 meV/atom. Including D, spread = −2.25 − (−2.36) = 0.11 eV/atom.
- 03Median of all four = (−2.27 + −2.29)/2 = −2.28 eV/atom; D sits 80 meV/atom below the median, while A–C all sit within 30 meV/atom of it.
- 04Check D’s method: it uses a different energy correction for transition-metal oxides. That plausibly explains a systematic shift.
- 05Record: formation energy −2.27 ± 0.02 eV/atom from sources A–C (spread 40 meV/atom); D flagged as a method-driven outlier and reported separately with its explanation.
An outlier with a known cause is not a problem — an outlier with no explanation is.
A band gap that looks like a metal
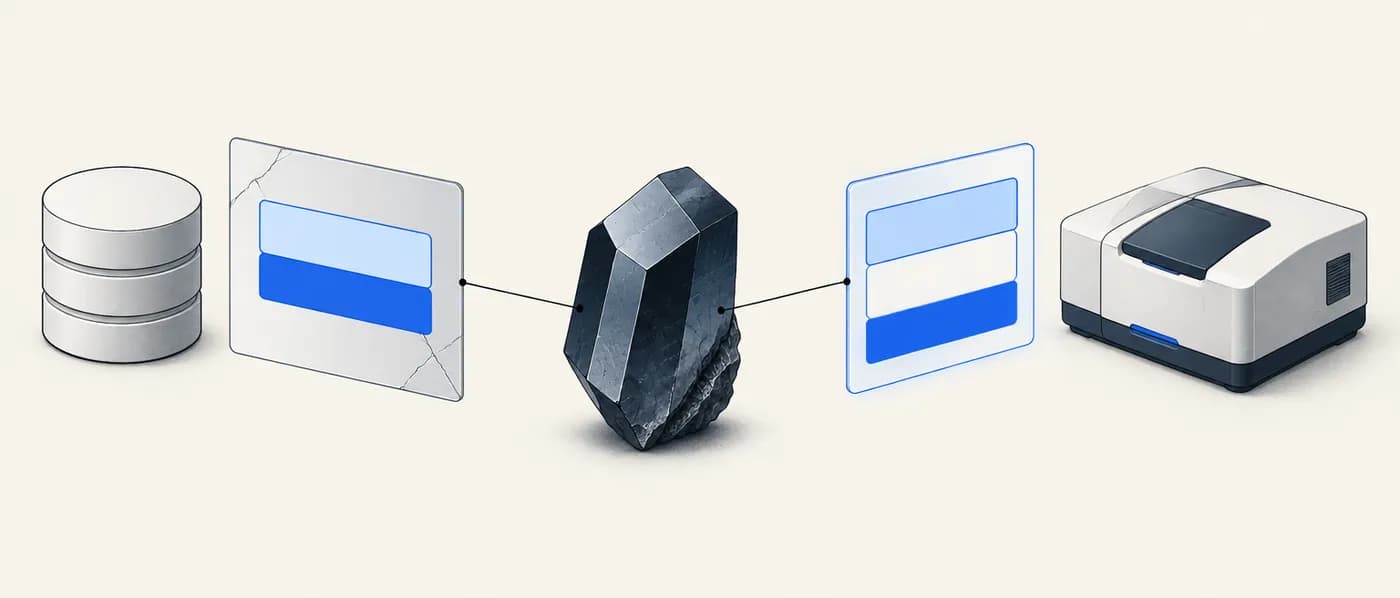
A screening filter for transparent conducting oxides drops Fe₂O₃ because the database entry it used lists the band gap as 0.0 eV (illustrative). Hematite is a well-known semiconductor with an experimental optical gap of roughly 2 eV.
- 01Look up the gap in a second computed source and in experimental literature.
- 02Find that standard semi-local DFT can return zero or near-zero gaps for strongly correlated, magnetic oxides — especially if the magnetic ordering or Hubbard U is not treated appropriately — while measurements report about 2 eV.
- 03Recognise the cause: a level-of-theory limitation, not a property of the material.
- 04Re-run the filter using measured gaps or higher-level calculations (DFT+U, hybrid functionals) for this class of compounds.
When one source contradicts textbook knowledge, check the method before you check the material.
Is this structure real? Computed stability plus experimental evidence
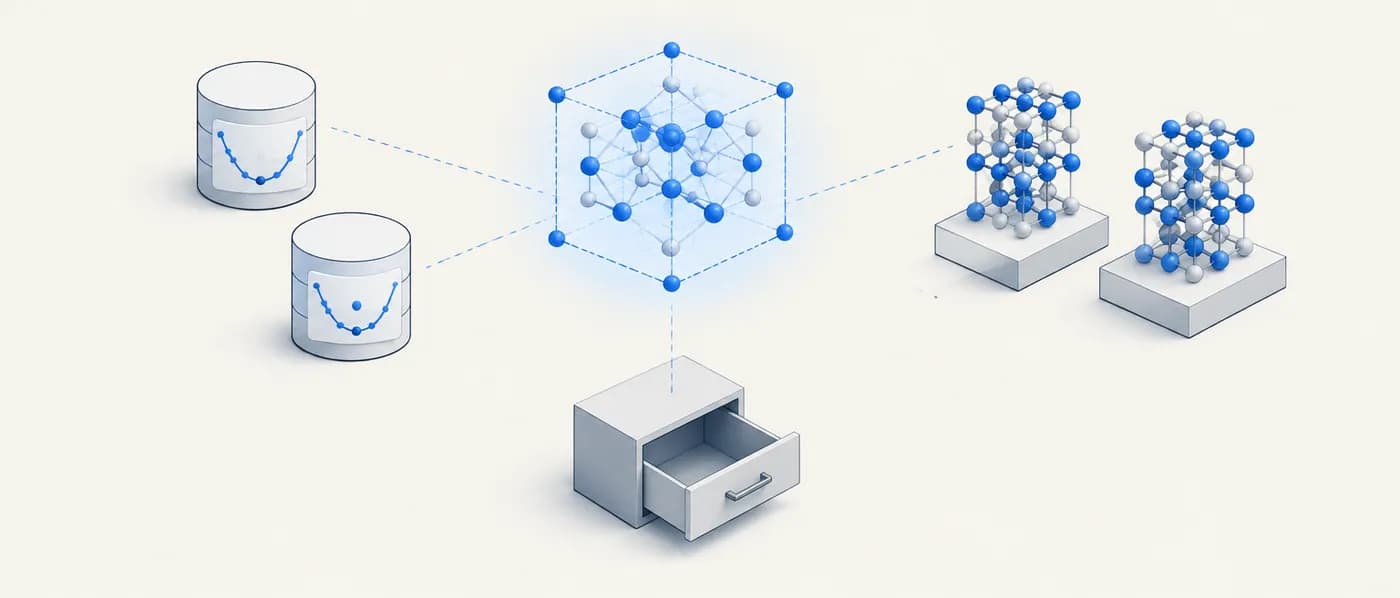
A new ternary nitride appears in an ML-generated structure set and is predicted on the hull. No paper mentions it.
- 01Check computed stability in a second, independently generated dataset: it is 15 meV/atom above the hull there (hypothetical).
- 02Search an experimental crystal-structure database for the composition: no entry.
- 03Search for related compositions in the same chemical system: two neighbouring ternaries have been made.
- 04Classify: computationally plausible in two sources, no experimental trace, chemically adjacent to known phases.
Agreement between computed sources and agreement between computation and experiment are different levels of confidence; say which one you have.
Common causes of cross-source disagreement
| Symptom | Likely cause | What to check |
|---|---|---|
| One source differs by a roughly constant offset for all oxides | Different energy correction or Hubbard U scheme | The source’s correction documentation; compare uncorrected energies |
| Band gap 0 eV in one source, >1 eV elsewhere | Semi-local functional on a correlated or magnetic compound, or a metallic polymorph | Functional, magnetic ordering, polymorph |
| Same formula, very different properties | Different polymorph or structure prototype | Space group and structure ID |
| Hull distances disagree although formation energies agree | Different sets of competing phases in each hull | Which competing phases each source includes |
| Negative ‘energy above hull’ | Signed stability convention rather than clamped hull distance | The field definition; clamp at zero before comparing |
When to use it — and when not to
- Before any number goes into a go/no-go decision, a report, or a customer-facing claim.
- When a screening filter removes a candidate on a single value close to the threshold.
- When a value contradicts what you know about the chemistry.
- When combining data from several databases into one dataset for analysis or model training.
- As a substitute for experiment when the decision really depends on a measured property — agreement among calculations does not validate the calculations’ shared assumptions.
- For properties only one source reports; there is nothing to triangulate, so label the value single-source instead.
- To average away a real physical effect, such as temperature dependence or genuine polymorphism.
Common mistakes
Applying it in Lattice Graph
LatticeGraph normalises the same material across many sources so triangulation is a view rather than a manual lookup. Cross-source confidence summarises how well independent sources agree; discrepancy flags highlight outliers; row-level provenance keeps each value tied to its origin and method.
- 01Open the material and switch to the confidence view to see each source’s value for the property side by side.
- 02Check the discrepancy flags: if one source is an outlier, open its provenance to see the method and phase behind it.
- 03Decide whether the spread is within your tolerance for this decision; if not, mark the value provisional.
- 04Add the value, spread and source list to your evidence pack so the reasoning travels with the number.
Frequently asked questions
How many sources do I need?
Two independent sources is the practical minimum; three makes it possible to spot which one is the outlier. Experimental evidence, where it exists, counts for more than another calculation using the same method.
Should I just average the sources?
Only after you have checked that they describe the same phase with compatible conventions and that no outlier has an unexplained cause. Often the median plus the spread is more honest than a mean.
What if all the computed sources agree but experiment disagrees?
Shared assumptions are the likely culprit — the same functional family, the same missing physics (temperature, defects, correlation). Prefer the measurement for decisions, and treat the calculations as consistent but systematically biased.
Is disagreement a reason to drop a candidate?
No. It is a reason to investigate. Some of the most useful findings in screening come from understanding why sources disagree.
References & further reading
- [1]Hegde, V. I., Borg, C. K. H., del Rosario, Z., Kim, Y., Hutchinson, M., Antono, E., Ling, J., Saxe, P., Saal, J. E., & Meredig, B. (2023). Quantifying uncertainty in high-throughput density functional theory: A comparison of AFLOW, Materials Project, and OQMD. Physical Review Materials, 7, 053805.Systematic comparison of how the same properties differ across three major computed databases.
- [2]Kirklin, S., Saal, J. E., Meredig, B., Thompson, A., Doak, J. W., Aykol, M., Rühl, S., & Wolverton, C. (2015). The Open Quantum Materials Database (OQMD): assessing the accuracy of DFT formation energies. npj Computational Materials, 1, 15010.Benchmarks computed formation energies against experiment and between DFT approaches.
- [3]Jain, A., Ong, S. P., Hautier, G., Chen, W., Richards, W. D., Dacek, S., Cholia, S., Gunter, D., Skinner, D., Ceder, G., & Persson, K. A. (2013). Commentary: The Materials Project: A materials genome approach to accelerating materials innovation. APL Materials, 1, 011002.Describes the Materials Project data and methods.
- [4]Wang, A., Kingsbury, R., McDermott, M., Horton, M., Jain, A., Ong, S. P., Dwaraknath, S., & Persson, K. A. (2021). A framework for quantifying uncertainty in DFT energy corrections. Scientific Reports, 11, 15496.Explains energy correction schemes and their uncertainties — a major source of cross-database offsets.