What it is
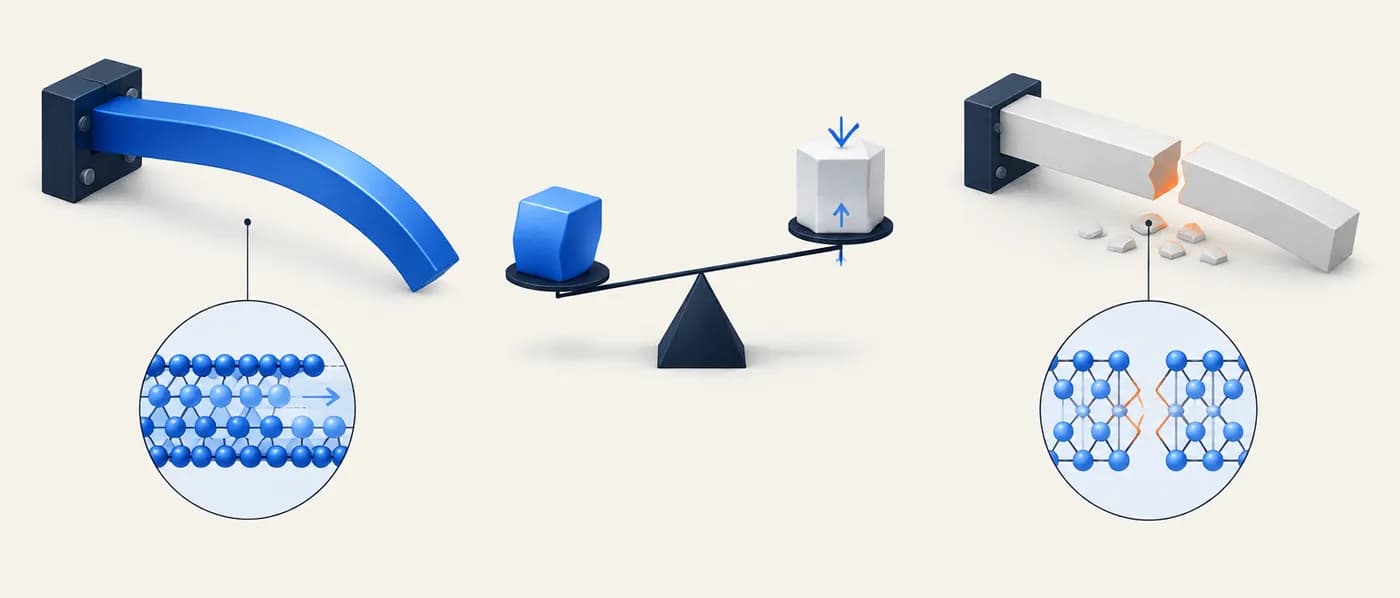
In 1954, S. F. Pugh studied polycrystalline pure metals and related their plastic behaviour to elastic moduli. The intuition: shear modulus G reflects resistance to plastic deformation (dislocation motion), while bulk modulus B reflects resistance to fracture (bond stretching). Pugh framed the comparison as G/B (low G/B favouring ductility); today it is usually quoted as B/G, where a high value means a material shears more easily than it breaks. Pugh did not state a sharp threshold: the critical B/G of about 1.75 (G/B ≈ 0.57) was attached to his work later and is now a widely used convention.
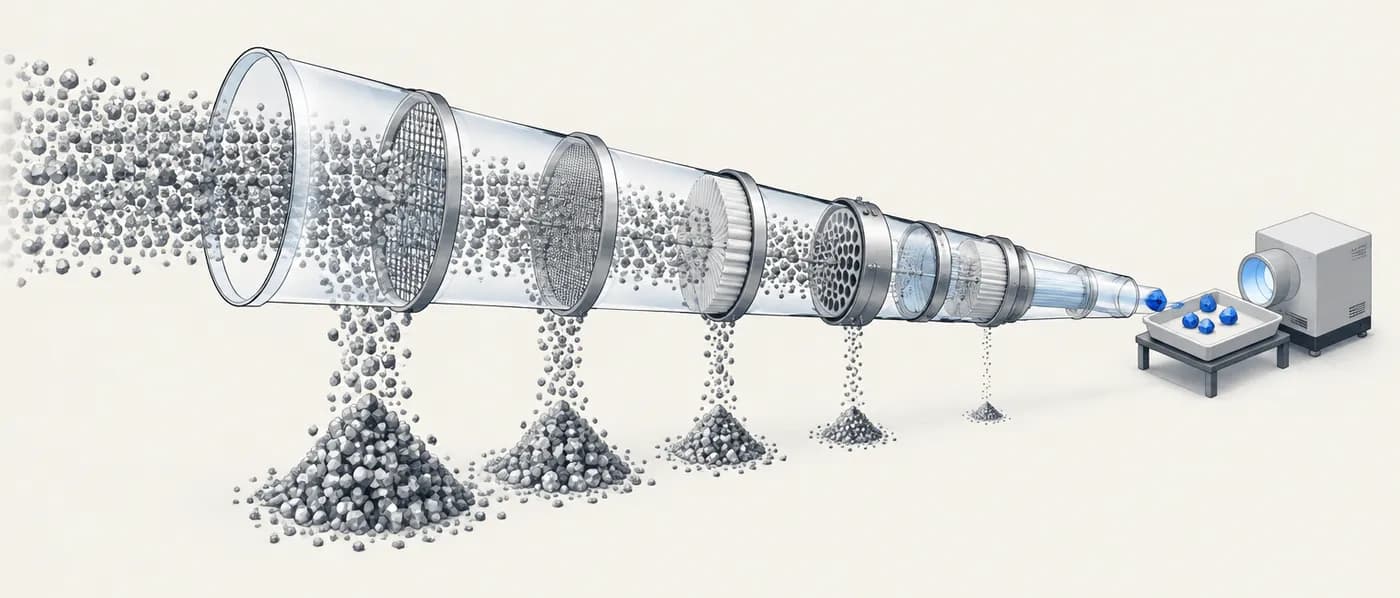
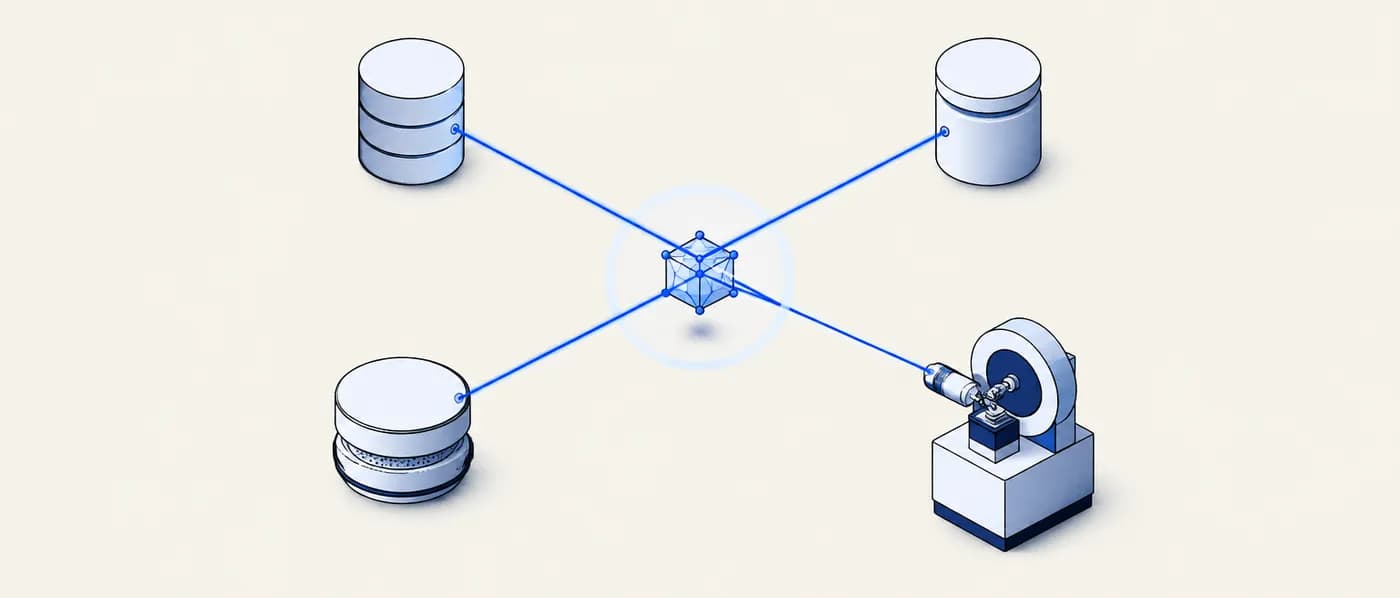
Because B/G depends only on elastic constants, it became a popular screen in computational materials science. Elastic tensors are routinely computed by DFT and stored in databases, so B/G can be estimated for thousands of crystals before anyone makes a sample. It is often paired with Poisson’s ratio (B/G = 1.75 corresponds to ν ≈ 0.26) and with the Cauchy pressure (C₁₂ − C₄₄ for cubic crystals), where positive values suggest metallic, non-directional bonding and negative values directional, covalent-like bonding.
Ductility in real materials depends on far more than elasticity: available slip systems, grain size, temperature, strain rate, impurities and microstructure. The Pugh ratio therefore works best as a first filter and a comparative tool within a family, not as a prediction of elongation or fracture toughness.
Why it matters for R&D decisions
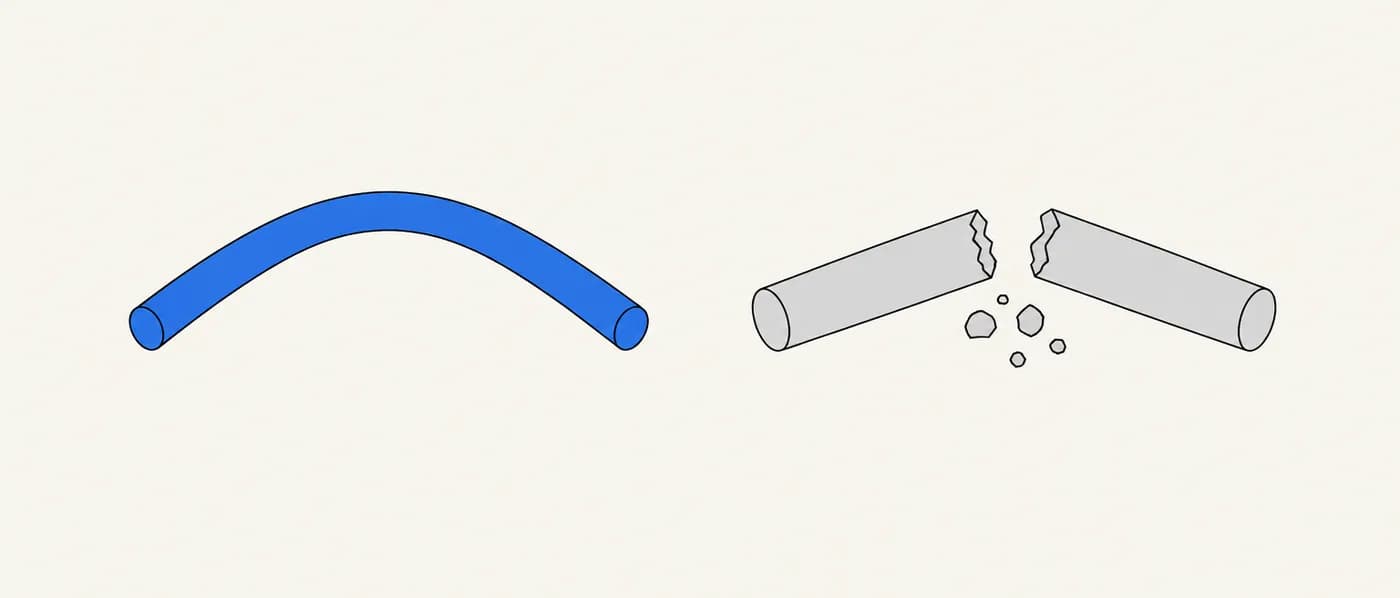
Brittle failure is a deal-breaker for many structural, coating and flexible-electronics applications. Screening out obviously brittle candidates early, especially among intermetallics and new compounds from computational searches, keeps synthesis effort on materials that can tolerate deformation. It also flags candidates where ductility needs alloying or microstructure work.
The formula
Pugh ratio = B / G (ductile if ≳ 1.75) · Cubic Voigt: B_V = (C₁₁ + 2C₁₂)/3, G_V = (C₁₁ − C₁₂ + 3C₄₄)/5 · ν = (3B − 2G) / (2(3B + G))
- B
- Bulk modulus (GPa), usually the Voigt–Reuss–Hill average for polycrystals
- G
- Shear modulus (GPa), usually the Voigt–Reuss–Hill average
- C₁₁, C₁₂, C₄₄
- Independent elastic constants of a cubic crystal
- G_R
- Reuss shear bound for cubic crystals: 5(C₁₁ − C₁₂)C₄₄ / (4C₄₄ + 3(C₁₁ − C₁₂)); Hill average G_H = (G_V + G_R)/2
- ν
- Poisson’s ratio; ν ≈ 0.26 corresponds to B/G ≈ 1.75
Use polycrystalline averages (VRH), not a single crystal direction, and check the elastic tensor is mechanically stable (positive definite) before computing ratios.
How to apply it, step by step
- 1Get the elastic tensor
Use measured elastic constants or a DFT elastic tensor from a database. Confirm it satisfies the Born stability criteria. An unstable tensor makes every derived ratio meaningless.
- 2Compute polycrystalline B and G
Use Voigt–Reuss–Hill averages. Many databases already report B_VRH and G_VRH.
- 3Compute B/G and related checks
Calculate B/G, Poisson’s ratio and, for cubic crystals, the Cauchy pressure C₁₂ − C₄₄. Consistent signals from all three are more convincing than one.
- 4Classify with a margin
Treat B/G well above 1.75 as likely ductile and well below as likely brittle. Values within about ±0.2 of the threshold are uncertain; do not over-interpret them.
- 5Cross-check with known behaviour
Compare against materials of the same structure and bonding type. Note crystal structure (bcc and hcp metals often show temperature-dependent or anisotropic ductility).
Worked examples
Copper from its elastic constants
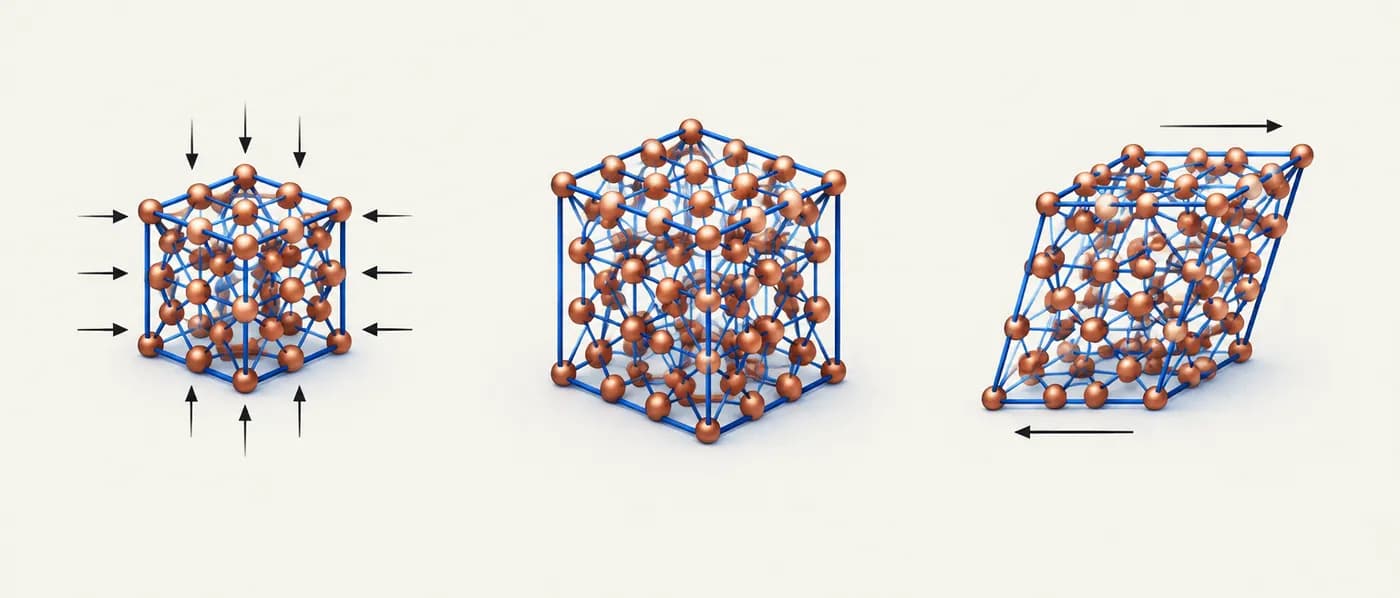
Compute the Pugh ratio of copper from single-crystal elastic constants C₁₁ ≈ 168, C₁₂ ≈ 121, C₄₄ ≈ 75 GPa.
- 01Bulk modulus (cubic): B = (C₁₁ + 2C₁₂)/3 = (168 + 242)/3 ≈ 136.7 GPa.
- 02Voigt shear: G_V = (C₁₁ − C₁₂ + 3C₄₄)/5 = (47 + 225)/5 = 54.4 GPa.
- 03Reuss shear: G_R = 5 × 47 × 75 / (4 × 75 + 3 × 47) = 17,625 / 441 ≈ 40.0 GPa.
- 04Hill average: G_H = (54.4 + 40.0)/2 ≈ 47.2 GPa.
- 05B/G ≈ 136.7 / 47.2 ≈ 2.9. Cauchy pressure C₁₂ − C₄₄ = 121 − 75 = 46 GPa (positive).
For a cubic metal, the full calculation takes a minute from three constants. Note how much G_V and G_R differ; always use the averaged value.
Ranking a mixed set of materials
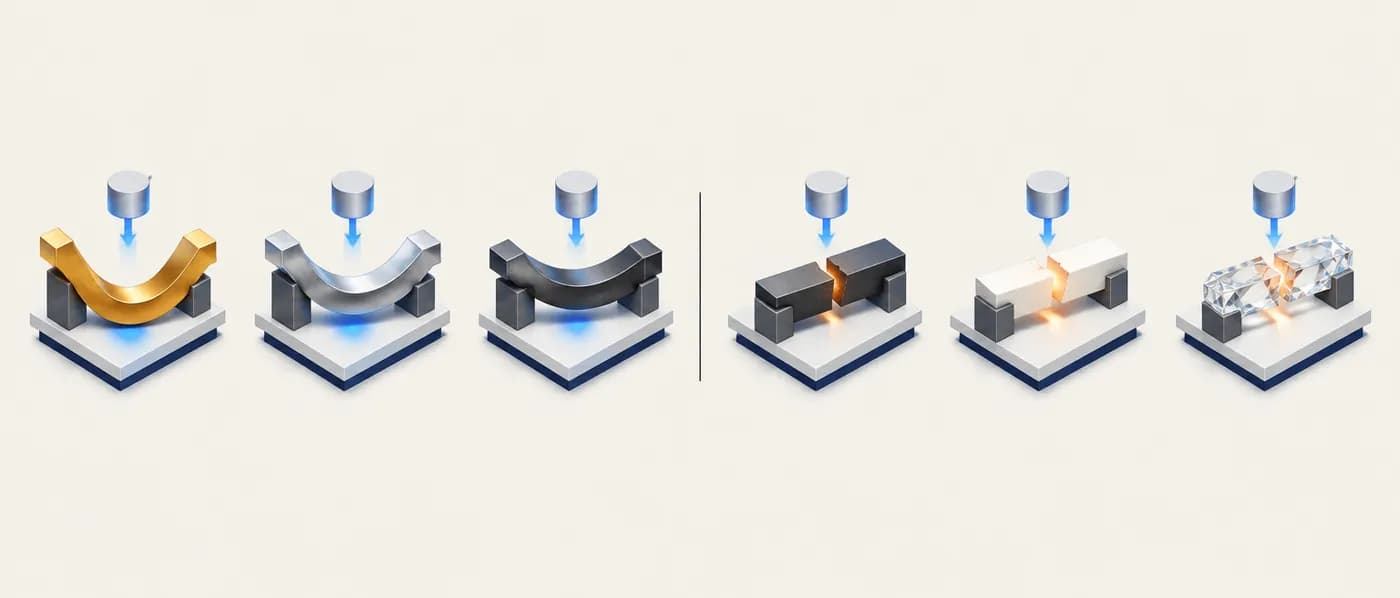
Compare approximate polycrystalline moduli for familiar materials.
- 01Gold: B ≈ 180, G ≈ 27 GPa → B/G ≈ 6.7 (very ductile).
- 02Aluminium: B ≈ 76, G ≈ 26 → ≈ 2.9 (ductile). Iron: B ≈ 170, G ≈ 82 → ≈ 2.1 (ductile at room temperature).
- 03Silicon: B ≈ 98, G ≈ 66 → ≈ 1.5 (brittle). Alumina: B ≈ 250, G ≈ 160 → ≈ 1.6 (brittle).
- 04Diamond: B ≈ 443, G ≈ 535 → ≈ 0.8 (brittle).
Across bonding types the screen works well. The hard cases are within one family and near the threshold.
Where it fails: tungsten and magnesium
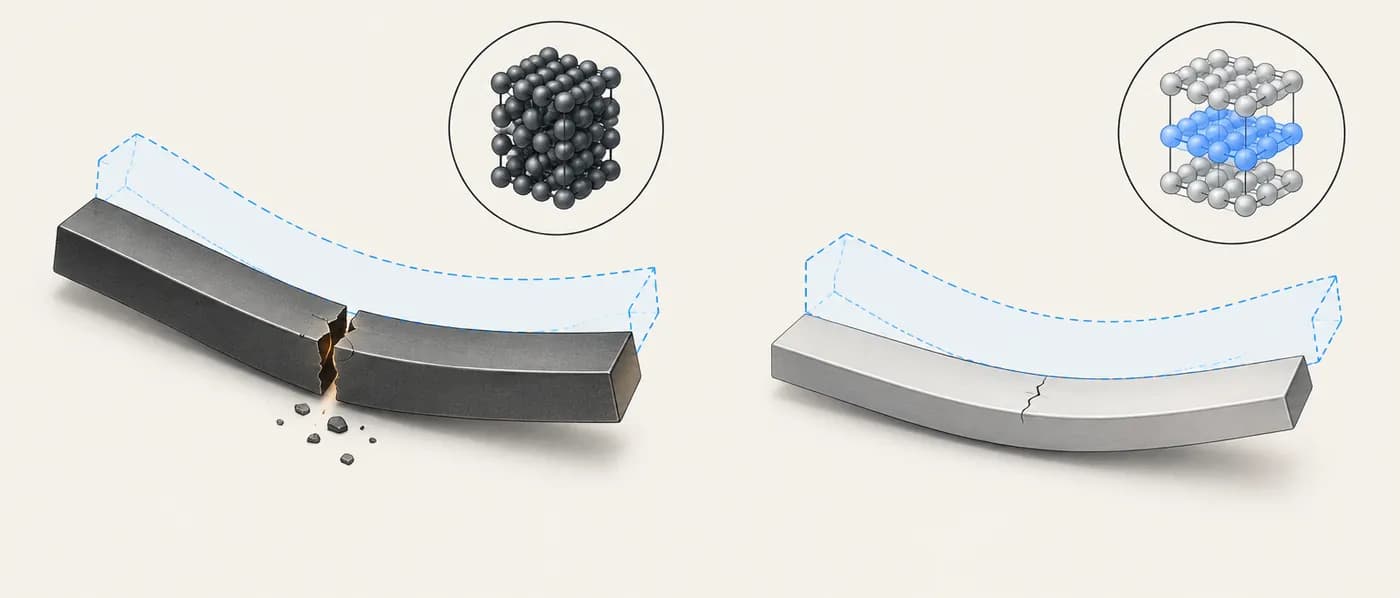
Two metals show why B/G is a heuristic.
- 01Tungsten: B ≈ 310, G ≈ 161 GPa → B/G ≈ 1.9, just above 1.75, so “ductile” by the rule.
- 02In practice, tungsten has a ductile-to-brittle transition above room temperature and is brittle at room temperature in common forms.
- 03Magnesium: B ≈ 45, G ≈ 17 GPa → B/G ≈ 2.6, comfortably “ductile”.
- 04Yet hcp magnesium has limited room-temperature formability because few slip systems are easily activated.
Elastic ratios cannot see temperature, slip-system availability or microstructure. Use B/G to filter, not to decide.
Approximate Pugh ratios of common materials (polycrystalline, room temperature)
| Material | B (GPa) | G (GPa) | B/G | Pugh classification | Observed behaviour |
|---|---|---|---|---|---|
| Gold | ≈ 180 | ≈ 27 | ≈ 6.7 | Ductile | Very ductile |
| Copper | ≈ 137–140 | ≈ 47–48 | ≈ 2.9 | Ductile | Ductile |
| Aluminium | ≈ 76 | ≈ 26 | ≈ 2.9 | Ductile | Ductile |
| Iron (bcc) | ≈ 170 | ≈ 82 | ≈ 2.1 | Ductile | Ductile at RT; DBTT in steels |
| Tungsten | ≈ 310 | ≈ 161 | ≈ 1.9 | Borderline ductile | Brittle at RT |
| Alumina | ≈ 250 | ≈ 160 | ≈ 1.6 | Brittle | Brittle |
| Silicon | ≈ 98 | ≈ 66 | ≈ 1.5 | Brittle | Brittle |
| Diamond | ≈ 443 | ≈ 535 | ≈ 0.8 | Brittle | Brittle |
When to use it — and when not to
- High-throughput screening of computed compounds and intermetallics for likely ductility.
- Comparing alloying or doping strategies that change elastic constants within one family.
- Flagging brittle candidates before investing in synthesis for load-bearing or flexible uses.
- Combining with Poisson’s ratio and Cauchy pressure for a quick bonding-character picture.
- To predict elongation, fracture toughness or fatigue life.
- For temperature-dependent behaviour such as the ductile-to-brittle transition in bcc metals.
- Near the threshold (roughly 1.55–1.95), where the classification is unreliable.
Common mistakes
Applying it in Lattice Graph
LatticeGraph exposes computed elastic properties, so B/G can be calculated and compared across sources during a search.
- 01Filter candidates by stability and composition, then pull B_VRH and G_VRH from computed elasticity data.
- 02Compute B/G (and Poisson’s ratio) and flag values near 1.75 as uncertain.
- 03Check cross-source agreement on moduli before relying on the classification.
Frequently asked questions
Where does the 1.75 threshold come from?
Pugh’s 1954 paper showed a trend (low G/B tends to mean ductile) but did not propose a sharp cut-off. The 1.75 value (G/B ≈ 0.57) was attached to his work by later authors and is now a widely used convention. It corresponds to a Poisson’s ratio of about 0.26.
Is a high Poisson’s ratio the same signal?
Essentially yes for isotropic materials, since ν is a function of B/G. Many papers report both.
What is the Cauchy pressure?
For cubic crystals it is C₁₂ − C₄₄. Positive values suggest metallic, non-directional bonding (often ductile); negative values suggest directional, covalent-like bonding (often brittle).
Does the rule work for high-entropy alloys?
It is widely used to screen them, but microstructure, ordering and temperature often dominate, so treat results as a starting point.
References & further reading
- [1]Pugh, S. F. (1954). Relations between the elastic moduli and the plastic properties of polycrystalline pure metals. Philosophical Magazine, 45(367), 823–843.Original elastic-moduli–ductility relation (framed as G/B; no explicit 1.75 threshold).
- [2]Pettifor, D. G. (1992). Theoretical predictions of structure and related properties of intermetallics. Materials Science and Technology, 8(4), 345–349.Cauchy pressure as an indicator of bonding character.
- [3]Hill, R. (1952). The elastic behaviour of a crystalline aggregate. Proceedings of the Physical Society A, 65(5), 349–354.Voigt–Reuss–Hill averaging of elastic constants.
- [4]de Jong, M. et al. (2015). Charting the complete elastic properties of inorganic crystalline compounds. Scientific Data, 2, 150009.Materials Project elastic-tensor dataset.