What it is
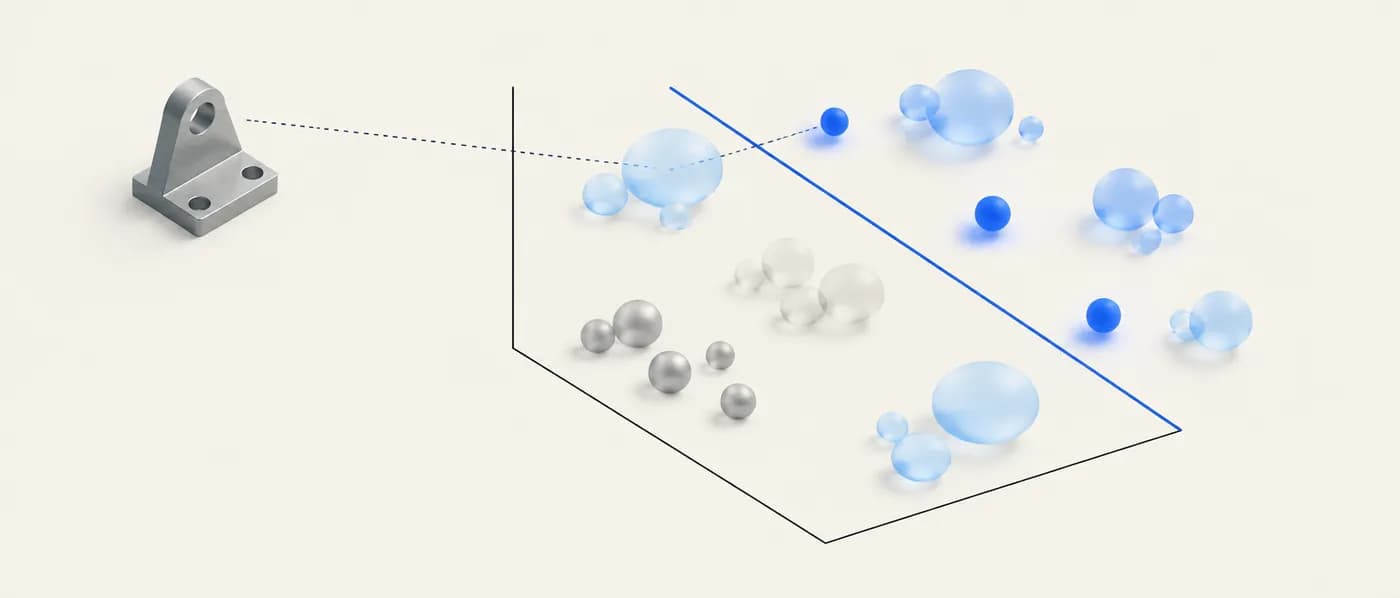
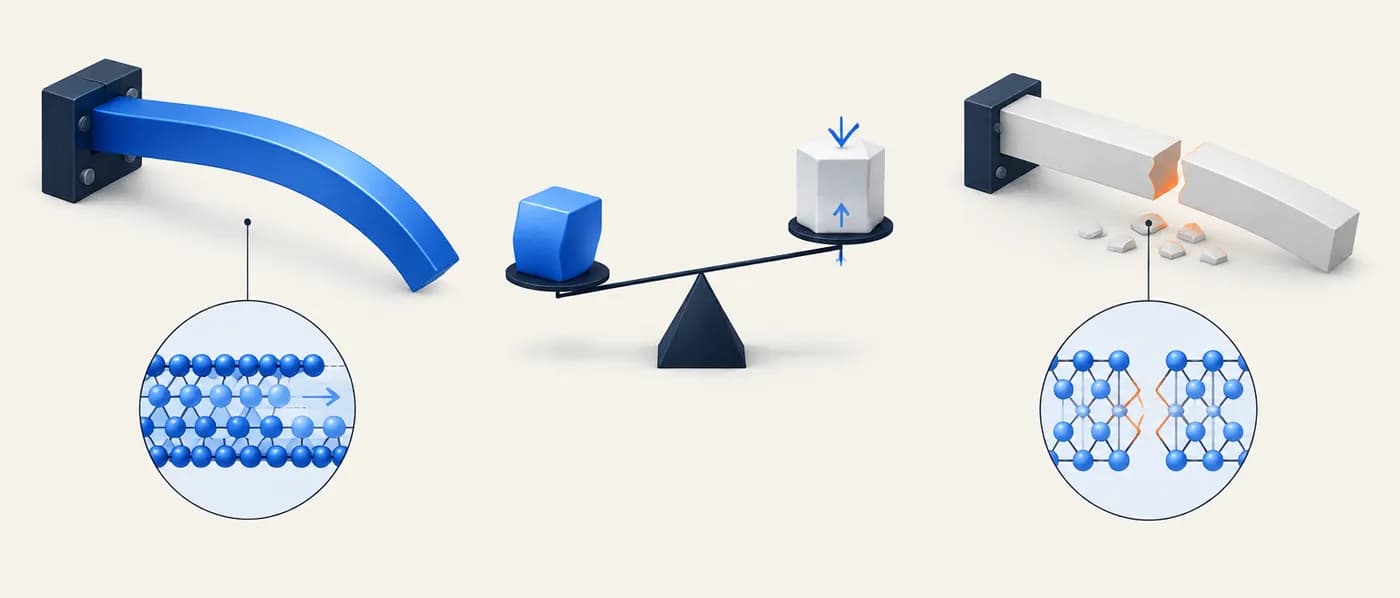
Michael Ashby showed that the performance of a structural component can usually be separated into three parts: functional requirements (loads, stiffness targets), geometry, and material properties. The material part, a combination such as E/ρ or σ_f^⅔/ρ, is the material index. Maximising it maximises performance, whatever the exact loads and dimensions.
Indices are derived, not memorised. Write the objective (for example, mass m = A·L·ρ), write the constraint (for example, stiffness S = E·A/L), eliminate the free geometric variable (here the cross-section A), and what remains is the material combination to maximise. Different loading modes give different exponents, because stiffness and strength scale differently with section size in tension, bending and plate bending.
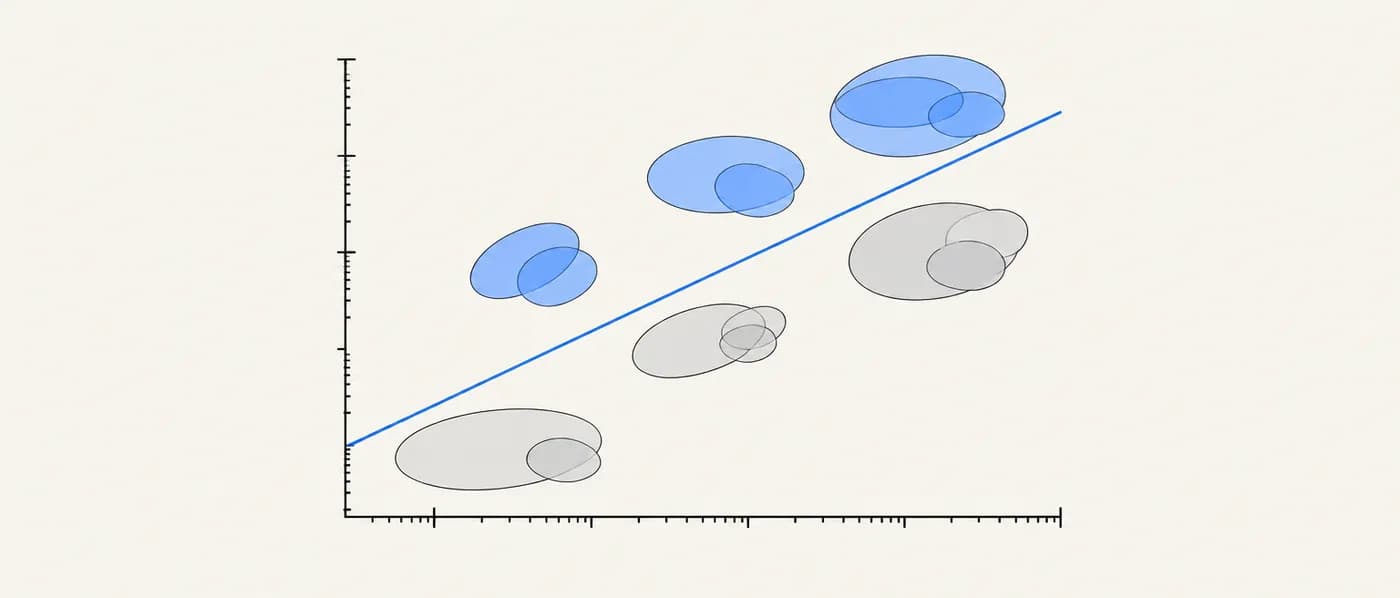
Indices pair naturally with Ashby property charts: log–log plots of, say, Young’s modulus against density. On these charts each index is a family of straight lines with a fixed slope. Moving a line toward better performance leaves only the best candidates above it.
Why it matters for R&D decisions
Single-property rankings mislead. “Stiffest” and “lightest” point to different materials, and neither is the best light, stiff beam. Indices encode the trade-off physically, so teams compare materials on what actually matters for the part and avoid both over-engineering and false economies.
The formula
Light, stiff tie: E/ρ · Light, stiff beam: E^½/ρ · Light, stiff plate: E^⅓/ρ · Light, strong tie: σ_f/ρ · Light, strong beam: σ_f^⅔/ρ · Light, strong plate: σ_f^½/ρ
- E
- Young’s modulus (GPa)
- σ_f
- Failure strength: yield strength for metals, tensile or flexural strength for others (MPa)
- ρ
- Density (Mg/m³ = g/cm³)
- C_m
- Material cost per kg; replace ρ with C_m·ρ for cost-limited designs
Beam indices assume the section shape is fixed and scales self-similarly; plate indices assume fixed area with free thickness. If those assumptions change, re-derive the index.
How to apply it, step by step
- 1Define function, objective and constraints
For example: a beam (function) that must not deflect more than δ under load F (constraint), made as light as possible (objective), with section size free.
- 2Write the objective equation
Express the quantity to minimise (mass, cost, embodied energy) in terms of geometry and material properties, e.g. m = A·L·ρ.
- 3Eliminate the free variable
Use the constraint, e.g. stiffness S = C·E·I/L³ with I = A²/12 for a square section, to solve for A and substitute into the objective.
- 4Read off the index
Group the material properties. For the beam, m ∝ ρ/E^½, so maximise M = E^½/ρ.
- 5Screen, then rank
First remove materials that fail hard constraints (temperature, corrosion, toughness, manufacturability). Then rank the rest by the index, or draw the index line on a property chart.
- 6Check the winners
Look at the top few for cost, joining, fatigue and supply. Indices handle performance; the rest is still engineering judgement.
Worked examples
Light, stiff beam: why steel loses
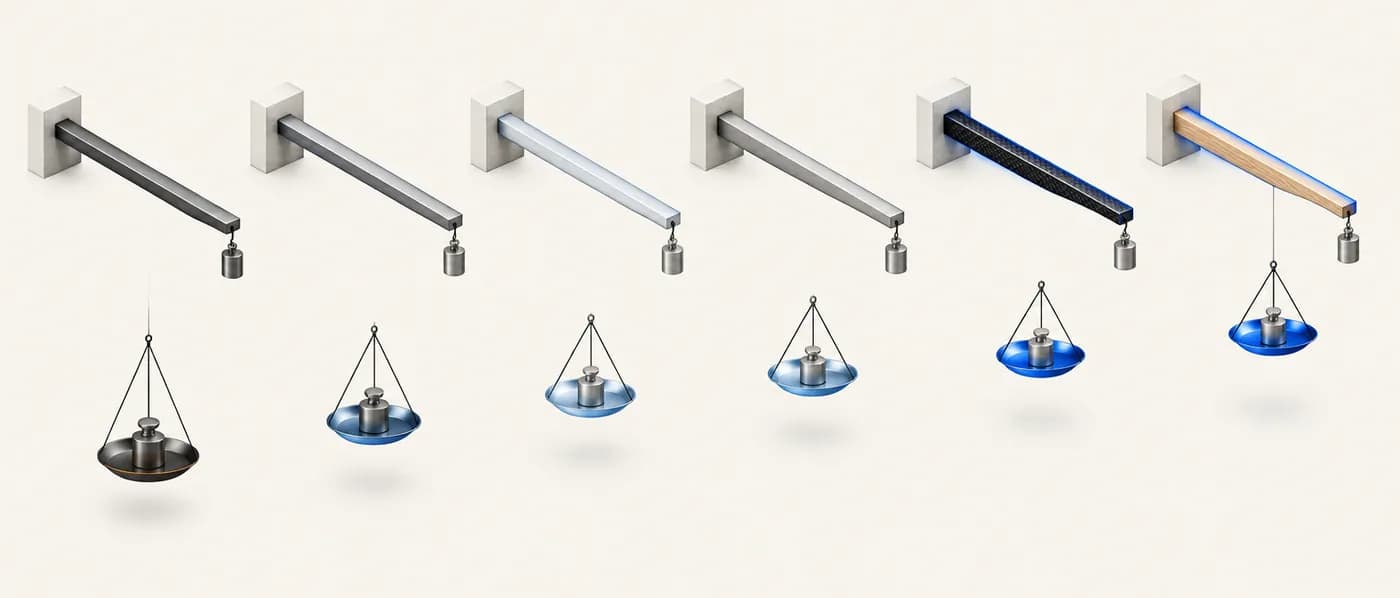
Compare common materials for a light, stiff beam using M = E^½/ρ, units GPa^½ per Mg/m³.
- 01Steel: E ≈ 210 GPa, ρ ≈ 7.8 → √210 ≈ 14.5 → M ≈ 14.5 / 7.8 ≈ 1.9.
- 02Titanium alloy (Ti-6Al-4V): E ≈ 114 GPa, ρ ≈ 4.43 → √114 ≈ 10.7 → M ≈ 2.4.
- 03Aluminium alloy: E ≈ 70 GPa, ρ ≈ 2.7 → √70 ≈ 8.4 → M ≈ 3.1.
- 04Magnesium alloy: E ≈ 45 GPa, ρ ≈ 1.8 → √45 ≈ 6.7 → M ≈ 3.7.
- 05Quasi-isotropic CFRP: E ≈ 70 GPa, ρ ≈ 1.6 → M ≈ 5.2. Wood along the grain: E ≈ 10 GPa, ρ ≈ 0.5 → √10 ≈ 3.2 → M ≈ 6.3.
In bending, density matters more than modulus because stiffness grows faster than mass as the section gets bigger.
Same materials, different loading: tie vs panel
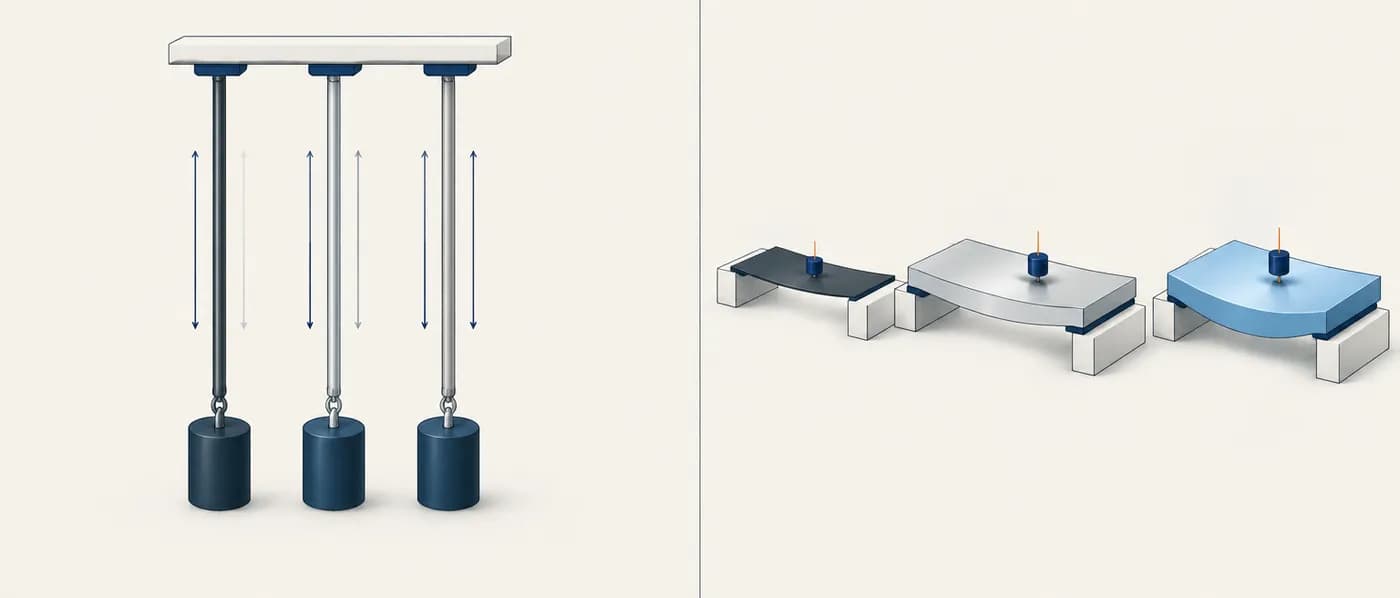
Show how the ranking changes with loading mode.
- 01Tie, M = E/ρ: steel 210/7.8 ≈ 27; aluminium 70/2.7 ≈ 26; titanium 114/4.43 ≈ 26; CFRP 70/1.6 ≈ 44.
- 02The common metals are nearly tied in tension; specific stiffness is similar across them.
- 03Panel, M = E^⅓/ρ: steel ∛210 ≈ 5.94 → 0.76; aluminium ∛70 ≈ 4.12 → 1.53; magnesium ∛45 ≈ 3.56 → 1.98; CFRP 4.12/1.6 ≈ 2.6.
- 04For panels the light materials pull further ahead; magnesium beats aluminium by about 30%.
Always derive the index for the actual loading. Choosing on E/ρ for a panel would miss magnesium’s advantage.
Cost-limited stiff beam (hypothetical prices)
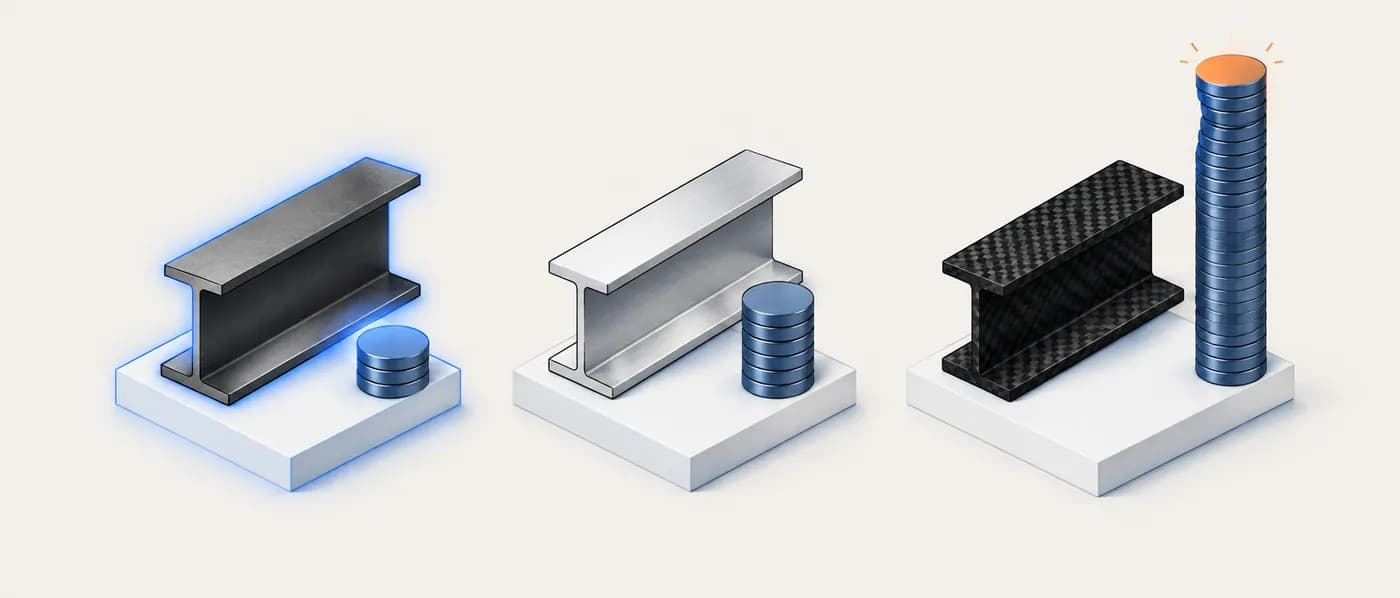
A high-volume part must be stiff and cheap rather than light. Use M = E^½ / (C_m·ρ) with illustrative prices: steel $1/kg, aluminium $3/kg, CFRP $30/kg.
- 01Steel: 1.9 / 1 ≈ 1.9.
- 02Aluminium: 3.1 / 3 ≈ 1.0.
- 03CFRP: 5.2 / 30 ≈ 0.17.
The objective decides the index. Light and cheap point to different materials, so say which one you mean.
Common material indices (maximise)
| Component and loading | Stiffness-limited | Strength-limited | Free variable |
|---|---|---|---|
| Tie in tension | E/ρ | σ_f/ρ | Cross-section area |
| Beam in bending | E^½/ρ | σ_f^⅔/ρ | Section size (shape fixed) |
| Panel / plate in bending | E^⅓/ρ | σ_f^½/ρ | Thickness |
| Column in buckling | E^½/ρ | — | Section size |
| Spring (max stored energy per volume) | — | σ_f²/E | — |
| Cost-limited versions | Replace ρ with C_m·ρ | Replace ρ with C_m·ρ | As above |
When to use it — and when not to
- Choosing materials for structural or mechanical parts early in design.
- Explaining to stakeholders why the stiffest or strongest material is not the best choice.
- Comparing a new material against incumbents for a defined use.
- Spotting which property improvement would matter most for a target application.
- When shape is also being optimised freely. Add shape factors or use full optimisation.
- When the binding constraint is non-mechanical (temperature, corrosion, conductivity) and has not been screened first.
- When properties are strongly anisotropic or size-dependent and a single E or σ_f would mislead.
Common mistakes
Applying it in Lattice Graph
LatticeGraph exposes computed elastic properties alongside density, so you can compute indices for crystalline candidates during a search.
- 01Filter candidates by composition, stability and density, then pull bulk and shear moduli from computed elasticity data.
- 02Compute the index for your loading mode and sort the shortlist by it.
- 03Check cross-source agreement on moduli before trusting a ranking, and remember that computed single-crystal values are not engineering alloy or composite properties.
Frequently asked questions
Why is the beam index E^½/ρ and not E/ρ?
Bending stiffness scales with the second moment of area, which grows with the square of the cross-section area for a fixed shape. Eliminating area leaves mass proportional to ρ/E^½.
Where do I find property charts?
Ashby’s textbook and Granta EduPack provide standard charts. You can also build your own from consistent property data.
Can I combine several indices?
Yes. When objectives conflict, for example mass and cost, plot one index against the other and use a Pareto front or an exchange constant to choose.
Do indices work for functional materials?
The method generalises to thermal, electrical and other objectives, e.g. thermal-insulation indices built from conductivity and diffusivity, as long as you can write the objective and constraint.
References & further reading
- [1]Ashby, M. F. (2011). Materials Selection in Mechanical Design (4th ed.). Butterworth-Heinemann.Derivations of material indices and property charts.
- [2]Ashby, M. F. & Cebon, D. (1993). Materials selection in mechanical design. Journal de Physique IV, 3(C7), C7-1–C7-9.Short overview of the method.
- [3]Ashby, M. F., Shercliff, H. & Cebon, D. (2018). Materials: Engineering, Science, Processing and Design (4th ed.). Butterworth-Heinemann.Introductory treatment with worked index examples.