What it is
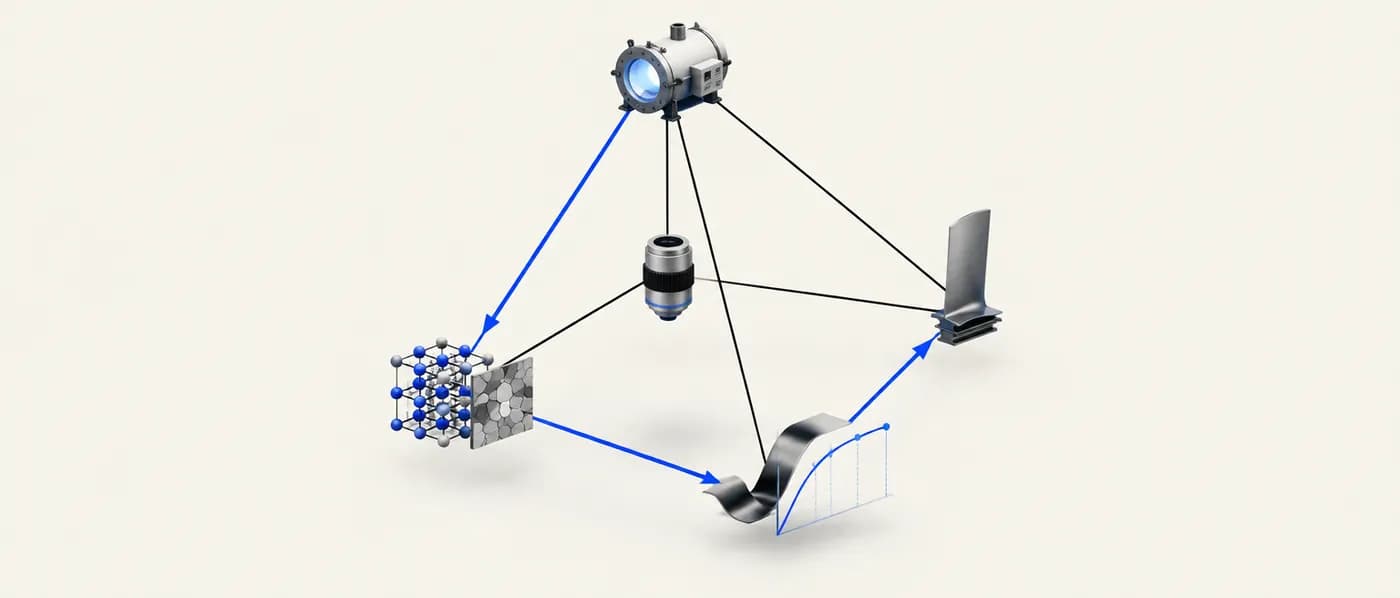
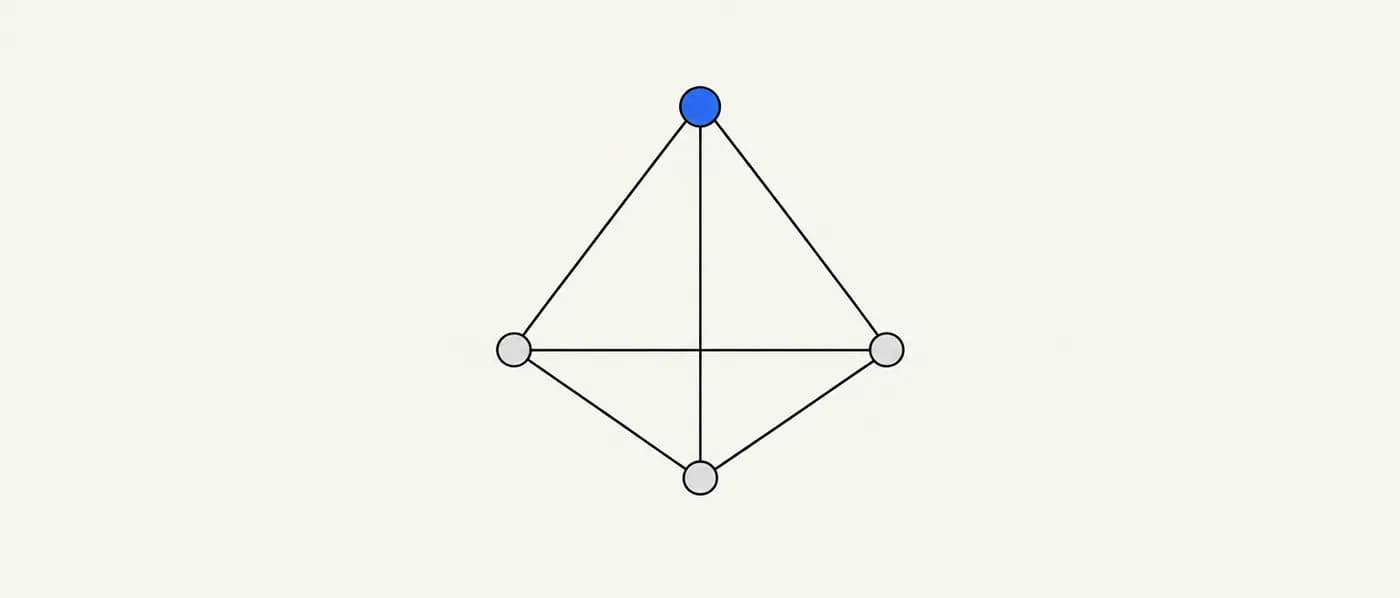
The processing–structure–properties–performance (PSPP) relationship is the central paradigm of materials science and engineering. It is often drawn as a tetrahedron with processing, structure, properties and performance at the four corners (with characterisation sometimes placed at the centre), a picture popularised by the US National Research Council’s 1989 report on materials science and engineering. Each edge represents a dependency: processing creates structure, structure governs properties, and properties determine how well a component performs its job.
‘Structure’ spans many length scales: the crystal structure and defects at the atomic scale, phases and grain boundaries at the micro scale, and porosity, texture or particle size at larger scales. Gregory Olson framed materials design as working backwards along the chain: start from the performance you need, decide which properties deliver it, identify the structures that give those properties, then choose processing routes that produce those structures.
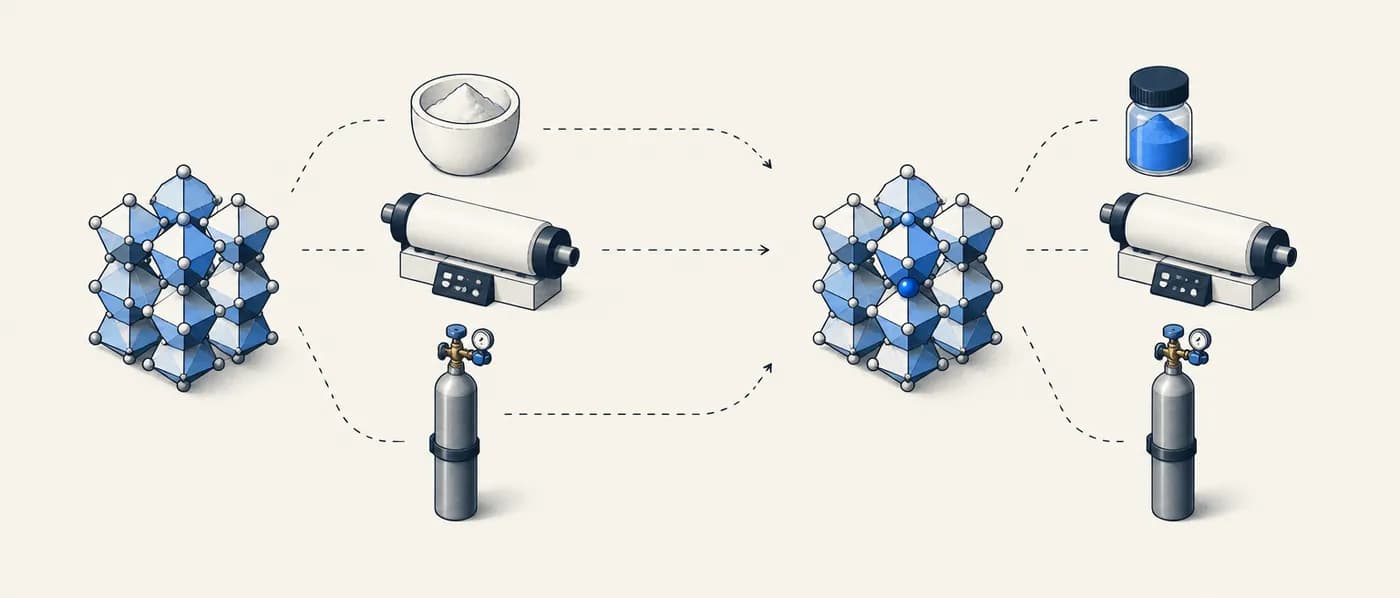
The practical message is simple. A chemical formula is not a material. Two LiFePO₄ powders, two batches of the same steel, or two silicon wafers can share a composition and still differ by orders of magnitude in a key property because they were processed differently.
Why it matters for R&D decisions
Most databases index materials by composition and crystal structure, but most measured properties depend on processing too. If you compare a conductivity measured on a dense, sintered pellet with one measured on a porous cold-pressed pellet, you are comparing processing routes, not materials. Thinking in PSPP terms tells you which differences in reported data are real, which experiments to run next, and why a promising computed material might still fail at scale.
How to apply it, step by step
- 1Start from performance, not composition
Write down the performance requirement in application terms (cycle life, turnover frequency, creep life at temperature). Then list the properties that control it. This keeps the work tied to what the customer or product actually needs.
- 2Map properties to the structural features that control them
For each property, ask which structural feature dominates: crystal structure, defect concentration, grain size, phase fraction, porosity, particle size, surface coating. Computed databases describe the ideal crystal; many properties are dominated by features they do not capture.
- 3Identify processing levers for each structural feature
Temperature profile, atmosphere, time, precursor choice, milling, pressure and cooling rate are the usual levers. Note which levers you control at lab scale and which will change at production scale.
- 4Characterise the structure, not just the property
Measure the structure you think you made — X-ray diffraction for phases, microscopy for grain and particle size, density for porosity — before interpreting a property. Without this, you cannot tell whether a poor result is the material or the processing.
- 5Record processing history with every data point
Store the synthesis route, temperatures, times, atmosphere and post-treatment alongside every measured value. This is the information most often missing from literature data and the reason many published values cannot be compared.
Worked examples
Same steel, two heat treatments
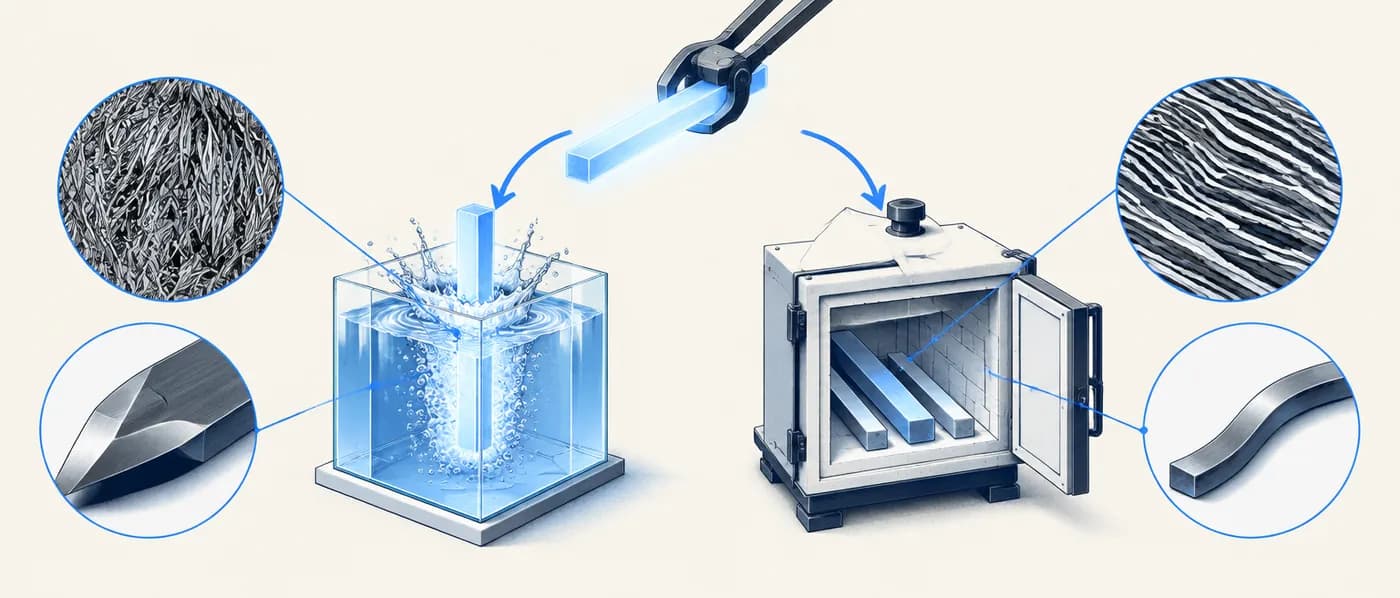
A plain carbon steel near the eutectoid composition (about 0.8 wt% C) is austenitised and then cooled in two ways.
- 01Processing A — quench rapidly in water: carbon cannot diffuse out, and austenite transforms to martensite.
- 02Structure A: martensite, a supersaturated body-centred tetragonal phase. Property A: very hard but brittle.
- 03Processing B — cool slowly in the furnace: carbon has time to diffuse, giving pearlite (alternating ferrite and cementite lamellae).
- 04Structure B: coarse pearlite. Property B: much softer, more ductile, tougher.
- 05Performance: A suits a cutting edge (usually after tempering); B suits parts that must absorb impact or be formed.
A composition-only database would treat these as the same material. Any property comparison must state the processing.
LiFePO₄: a slow cathode made fast by processing
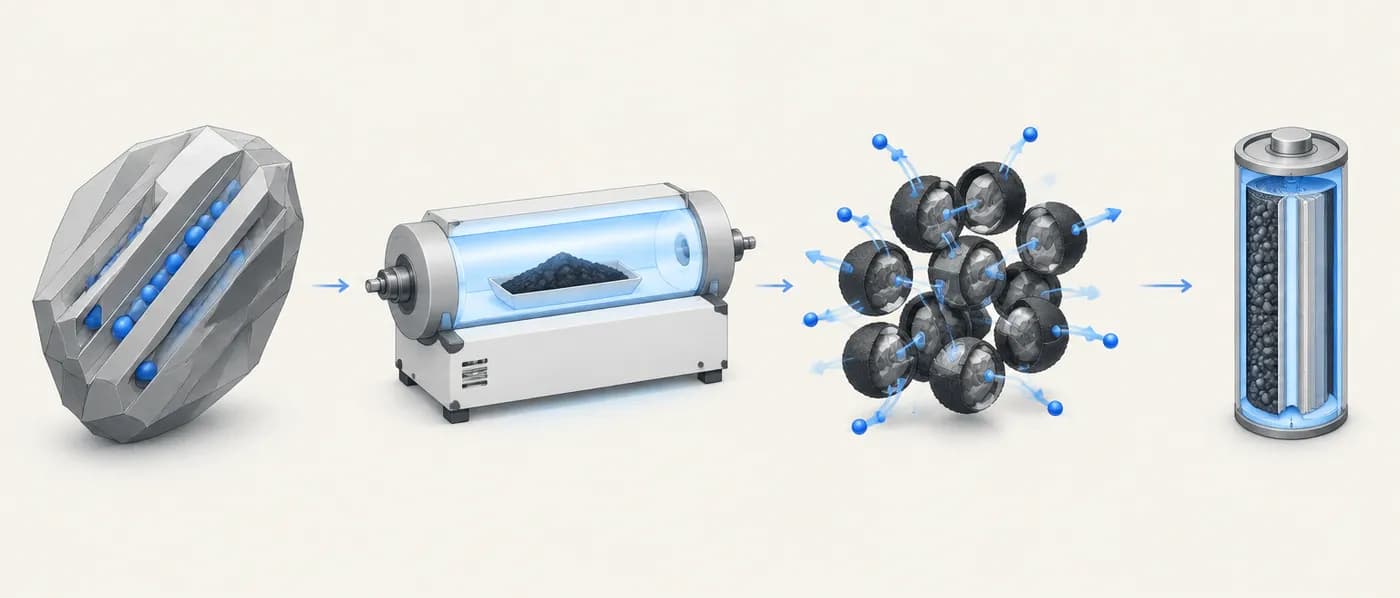
LiFePO₄ was reported as a lithium-battery cathode by Padhi, Nanjundaswamy and Goodenough in 1997. It is cheap, stable and safe, but intrinsically poor at conducting electrons and slow to transport lithium.
- 01Structure problem: the olivine crystal has low electronic conductivity and essentially one-dimensional Li diffusion channels.
- 02Processing lever 1 — reduce particle size to the sub-micron or nanoscale, shortening the Li diffusion path.
- 03Processing lever 2 — coat the particles with a thin conductive carbon layer, often by adding an organic carbon source during calcination.
- 04Property change: rate capability improves greatly, so the material can deliver most of its ~170 mAh/g theoretical capacity at practical currents.
- 05Performance: LiFePO₄ became a major commercial cathode, now widely used in electric vehicles and stationary storage.
A computed property of the ideal crystal (here, conductivity) can be the wrong basis for rejecting a material if processing can engineer around it.
Single-crystal turbine blades
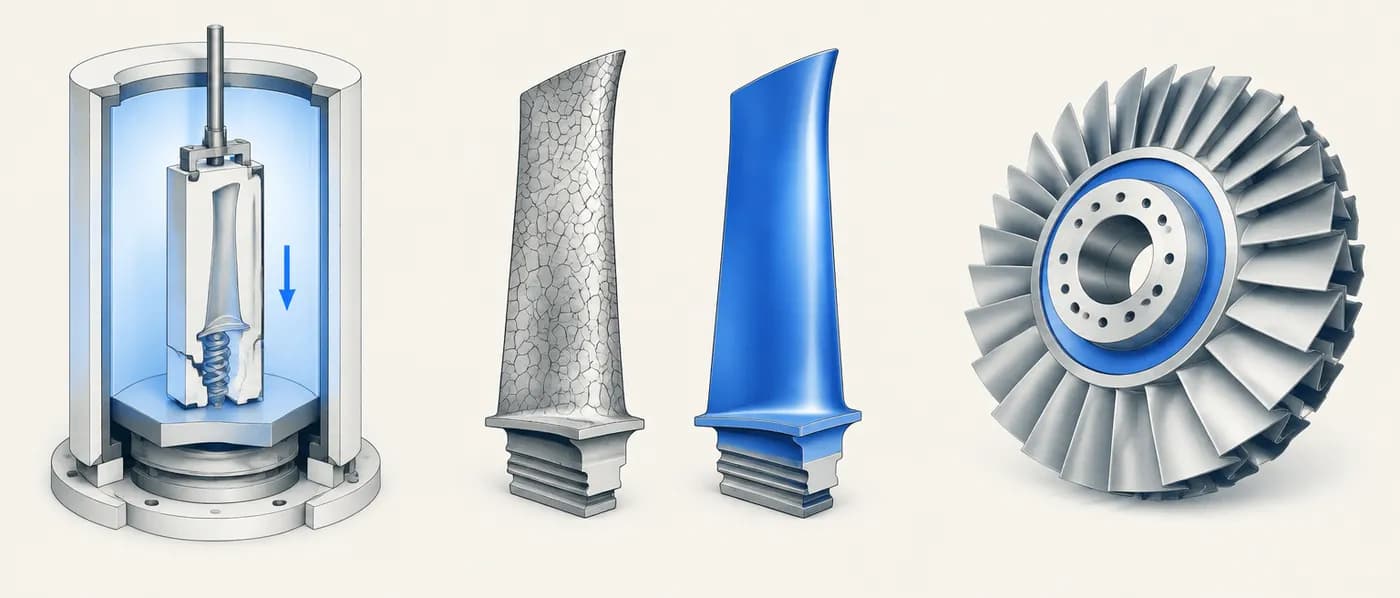
Nickel-based superalloy blades in jet-engine turbines must resist creep at very high temperature.
- 01Performance need: long creep life under high stress and temperature.
- 02Property: creep resistance, which is degraded by grain boundaries that slide and act as damage sites at high temperature.
- 03Structure solution: remove grain boundaries entirely by making each blade a single crystal.
- 04Processing: directional solidification with a grain selector, so only one grain grows through the casting.
Working backwards from performance can lead to a processing solution (eliminating grain boundaries) rather than a new composition.
Common processing levers and what they change
| Processing lever | Structural feature it changes | Typical property effect |
|---|---|---|
| Cooling rate | Phases present, grain size | Hardness, strength, toughness |
| Calcination / sintering temperature and time | Phase purity, density, grain growth | Ionic conductivity, mechanical strength |
| Atmosphere (inert, reducing, oxidising) | Oxidation states, defect and vacancy content | Electronic conductivity, colour, capacity |
| Milling and particle-size control | Particle size, surface area | Rate capability, catalytic activity, sinterability |
| Coating and surface treatment | Surface chemistry and interfaces | Electronic contact, stability against electrolyte |
| Doping level | Defect chemistry, phase stabilisation | Conductivity, phase stability |
When to use it — and when not to
- Interpreting why reported values for the same material disagree across papers.
- Planning experiments after a computational screen has picked a composition.
- Diagnosing why a lab result falls short of a predicted property.
- Planning scale-up, where processing routes often change.
- As a reason to ignore composition-level screening: processing cannot rescue a thermodynamically impossible or wrong-chemistry material.
- When properties are intrinsic and insensitive to processing (for example, the theoretical capacity set by formula weight and electron count).
Common mistakes
Applying it in Lattice Graph
Computed databases describe ideal crystal structures; synthesis and measurement records add the processing dimension. Use LatticeGraph to keep both linked to the same material.
- 01Search the composition and review computed structure and stability across sources.
- 02Open synthesis recipe records to see the processing routes reported for the same or similar chemistries.
- 03When comparing measured properties (for example conductivity), check each value’s source and method before treating differences as real.
- 04Include processing conditions next to every measured value in your evidence pack.
Frequently asked questions
Is the tetrahedron the same as the PSPP chain?
They describe the same relationships. The chain emphasises causality (processing → structure → properties → performance); the tetrahedron emphasises that all four are interconnected and are studied together, often with characterisation at the centre.
Which part is captured by DFT databases?
Mostly the atomic-scale structure of an ideal, defect-free crystal and the properties that follow from it. Microstructure, defects from processing and interfaces are largely outside standard DFT database entries.
How does this relate to ICME?
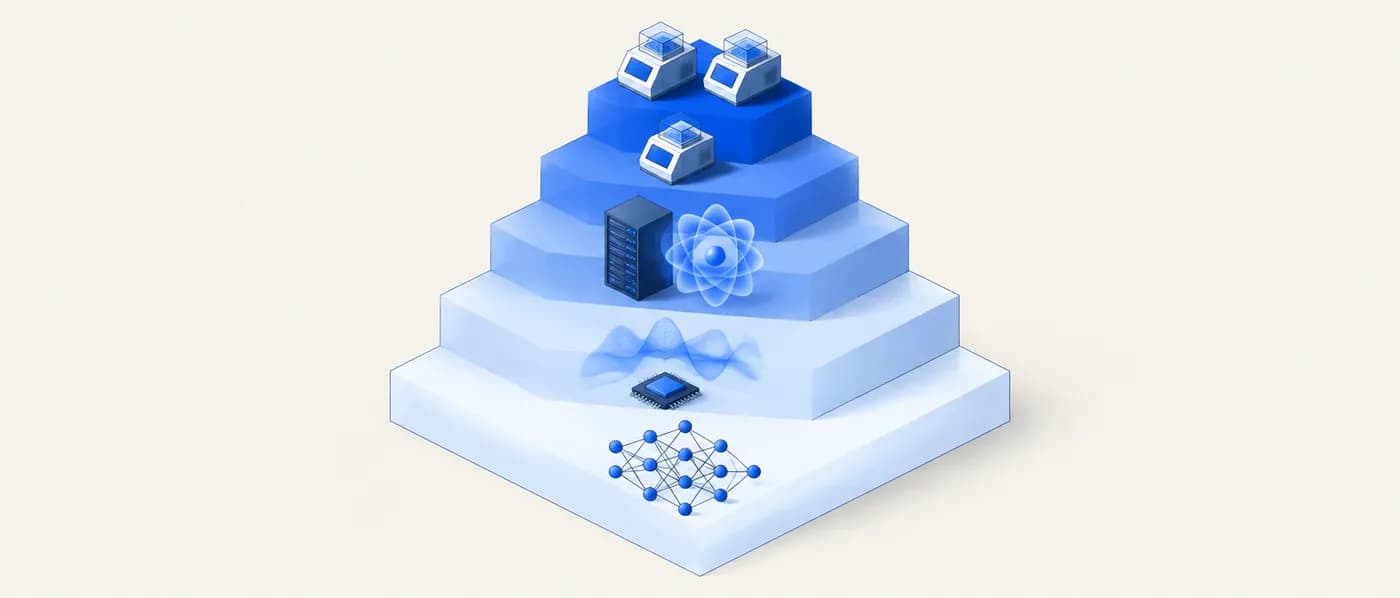
Integrated computational materials engineering (ICME) builds linked models for each step of the chain — process models, microstructure models and property models — so processing changes can be simulated before they are tried.
References & further reading
- [1]National Research Council (1989). Materials Science and Engineering for the 1990s: Maintaining Competitiveness in the Age of Materials. National Academy Press.Popularised the four-element tetrahedron view of the field.
- [2]Olson, G. B. (1997). Computational design of hierarchically structured materials. Science 277, 1237–1242.Systems-design view of the processing–structure–properties–performance chain.
- [3]Padhi, A. K., Nanjundaswamy, K. S. & Goodenough, J. B. (1997). Phospho-olivines as positive-electrode materials for rechargeable lithium batteries. Journal of the Electrochemical Society 144, 1188–1194.Original LiFePO₄ cathode report.
- [4]Callister, W. D. & Rethwisch, D. G. Materials Science and Engineering: An Introduction. Wiley (multiple editions).Standard textbook treatment of heat treatment of steels and structure–property relationships.