What it is
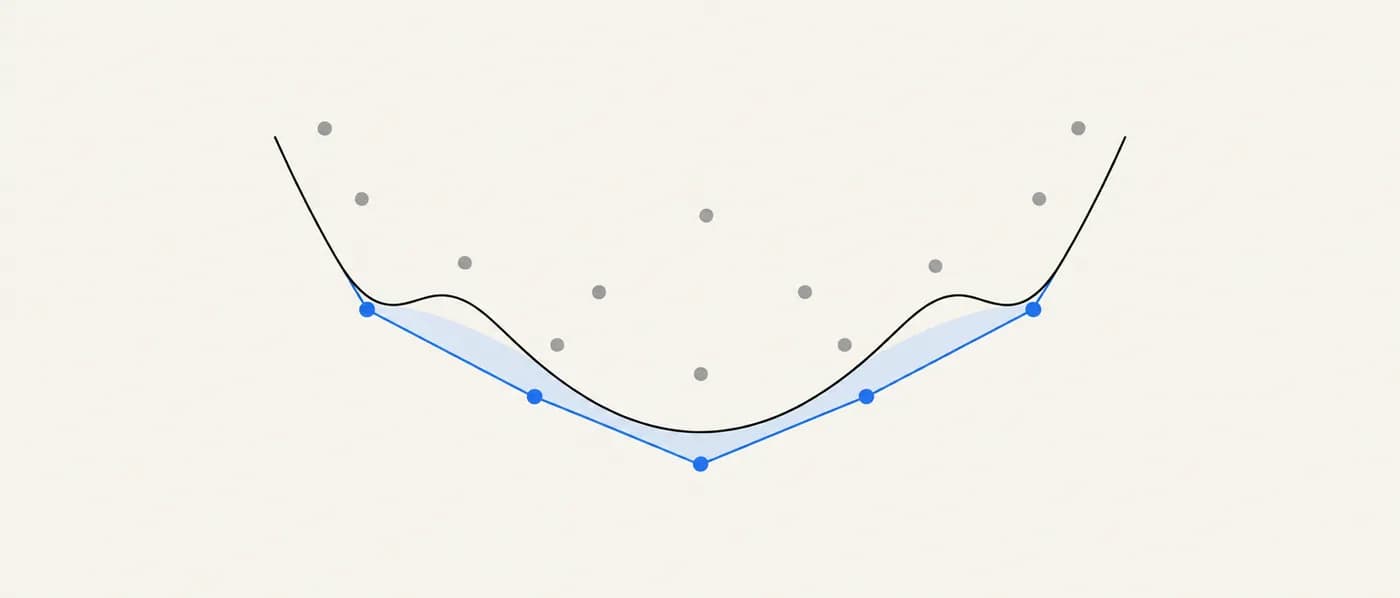
For a given chemical system (say Li–Fe–P–O), you can compute the formation energy per atom of every known and hypothetical compound. Plotting those energies against composition and taking the lower convex envelope gives the convex hull: the set of phases, and mixtures of phases, with the lowest possible energy at each composition.
The energy above hull (E_hull, sometimes called the decomposition energy or distance to hull) of a compound is the vertical distance between its formation energy and the hull at the same composition. A compound with E_hull = 0 is thermodynamically stable at 0 K within the model used. A compound with E_hull > 0 would, in principle, lower its energy by decomposing into the phases that define the hull beneath it.
Because the hull is built from computed energies (usually density functional theory, DFT), E_hull is a 0 K, zero-pressure estimate. It ignores vibrational and configurational entropy, temperature, pressure, surface energy and kinetics — which is exactly why many useful materials sit slightly above it.
Why it matters for R&D decisions
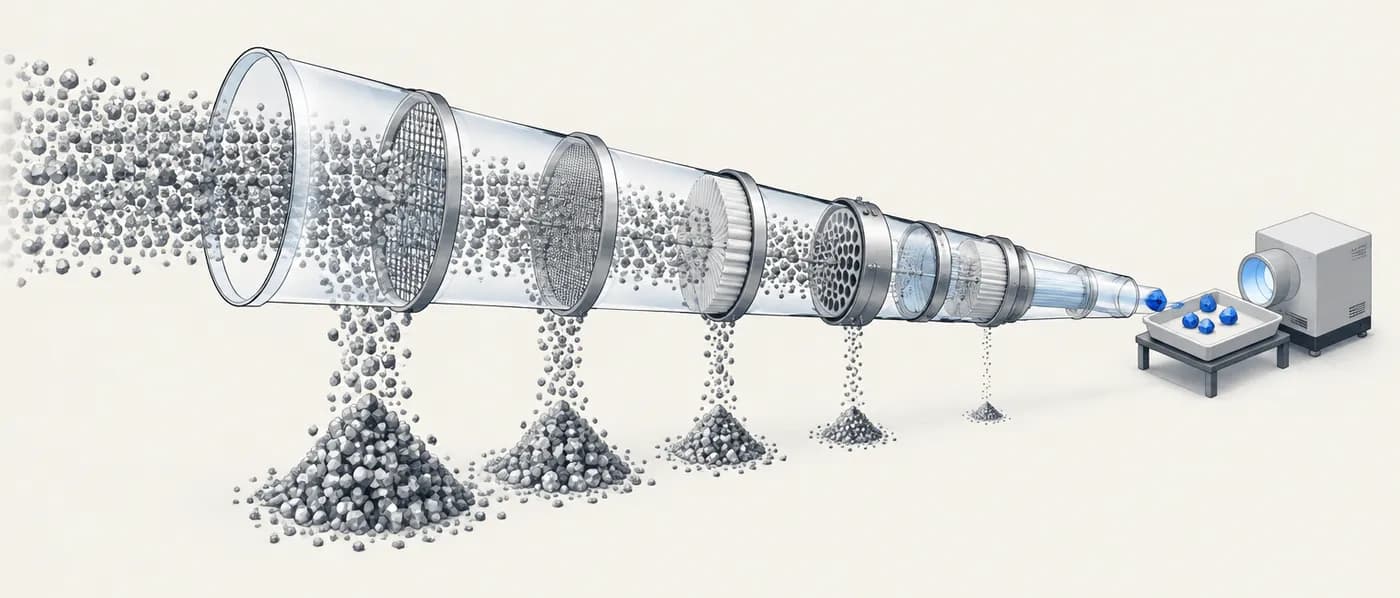
Energy above hull is the cheapest, most widely available stability signal in materials databases. Used well, it removes thousands of implausible candidates before anyone spends DFT time or lab time. Used badly — as a hard zero cut-off, or compared across databases with different corrections — it throws away real materials or lets artefacts through.
The formula
E_hull(c) = ΔH_f(c) − H_hull(x_c)
- ΔH_f(c)
- Formation energy per atom of compound c, relative to the elemental reference phases
- x_c
- Composition of c (atom fractions of each element)
- H_hull(x_c)
- Energy of the lower convex hull at that composition — the energy of the lowest-energy combination of competing phases with the same overall composition
- E_hull
- Energy above hull, in eV/atom or meV/atom; ≥ 0 by construction when c is included in the hull
Some databases report a signed value instead: the distance to a hull built without the compound itself. On-hull phases then show a negative number (how far below the other phases they are). Clamp such values at 0 before comparing with sources that report E_hull ≥ 0.
How to apply it, step by step
- 1Fix the chemical system and the data source
Pick the elements of interest and a single, consistent source of energies (same functional, same correction scheme). Hulls are only meaningful when every phase on them was computed the same way.
- 2Read or compute the hull distance
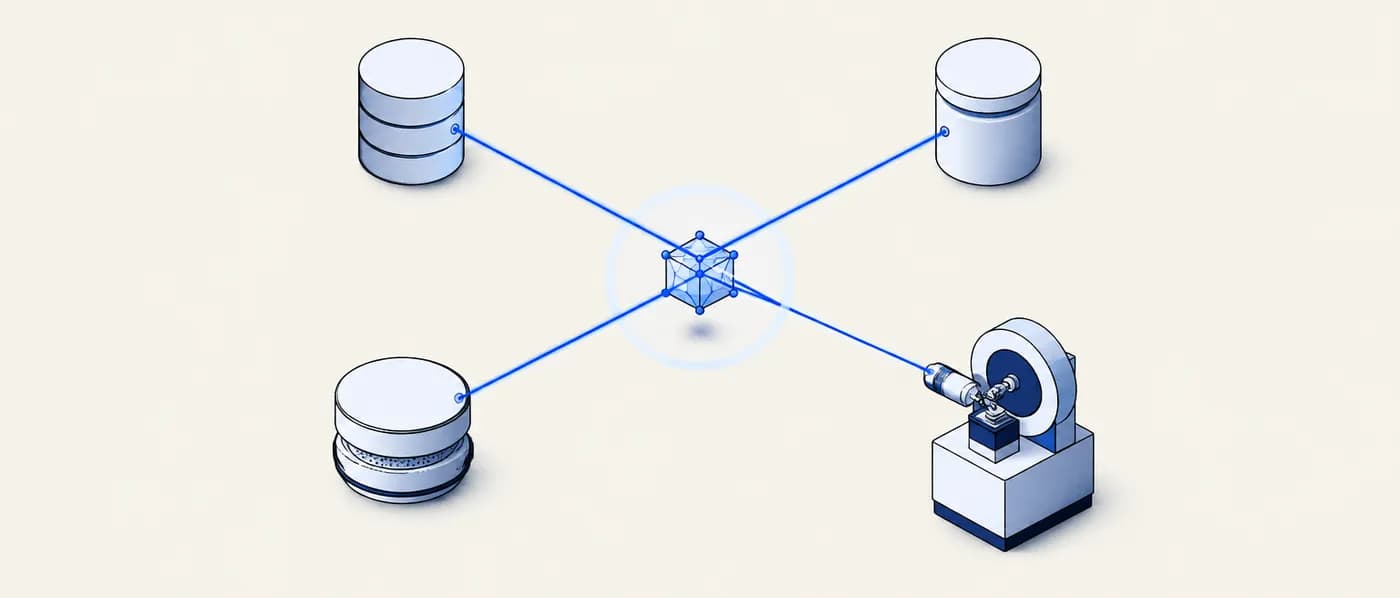
Most databases (Materials Project, OQMD, AFLOW, JARVIS, Alexandria) publish a hull distance per entry. If you compute your own, include every competing phase in the system — a missing phase makes the hull too high and every E_hull too small.
- 3Bin, don’t threshold
Translate the number into a plausibility band (see the table below) rather than a single cut-off. Keep a looser band early in a screen and tighten it later.
- 4Ask why a metastable candidate could exist
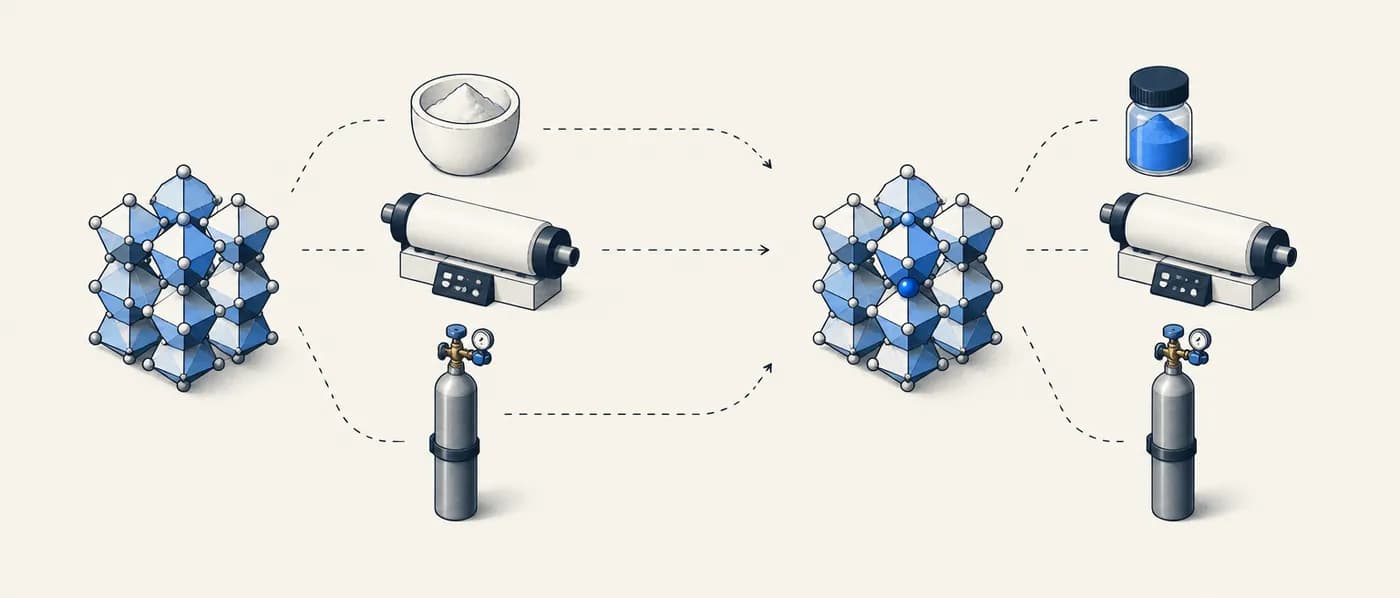
For anything clearly above zero, write down the mechanism that could stabilise it: high pressure, low-temperature (kinetic) synthesis, thin-film epitaxy, nanoscale size, or configurational entropy at synthesis temperature. No mechanism, lower priority.
- 5Cross-check across sources and against experiment
Compare the same composition and structure across independent databases, and look for an experimental structure (for example in the Crystallography Open Database). Agreement raises confidence; disagreement is a reason to look closer, not to average.
Worked examples
Computing E_hull in a simple binary
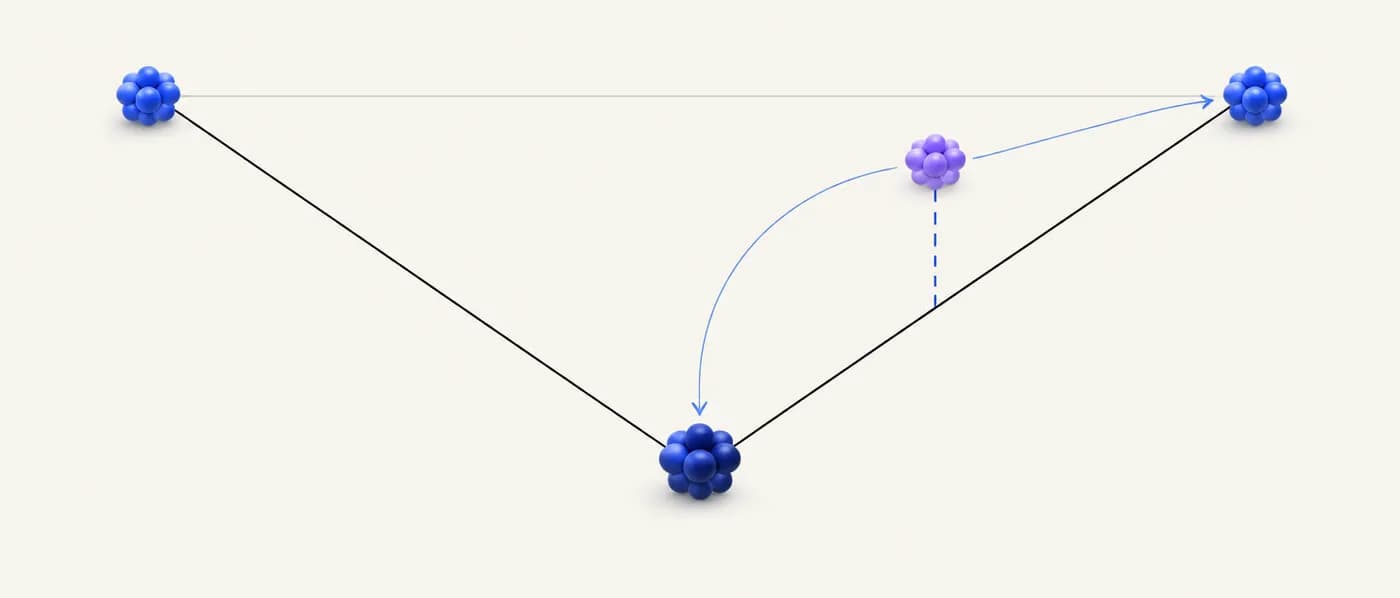
A hypothetical A–B system has three computed phases on the hull: pure A (x_B = 0, 0 eV/atom), AB (x_B = 0.5, −0.40 eV/atom) and pure B (x_B = 1, 0 eV/atom). A new candidate AB₂ (x_B = 2/3) has ΔH_f = −0.25 eV/atom.
- 01AB₂ lies between AB and B, so the hull at x_B = 2/3 is the straight line from (0.5, −0.40) to (1.0, 0).
- 02Slope of that segment = (0 − (−0.40)) / (1.0 − 0.5) = 0.80 eV/atom per unit x_B.
- 03Hull energy at x_B = 0.667: −0.40 + 0.80 × (0.667 − 0.5) = −0.40 + 0.133 = −0.267 eV/atom.
- 04E_hull = −0.25 − (−0.267) = 0.017 eV/atom ≈ 17 meV/atom.
- 05Lever rule for the decomposition products: fraction of atoms in AB = (1 − 0.667)/(1 − 0.5) ≈ 0.67; the remaining ≈ 0.33 is B.
Being strongly negative in formation energy is not enough — what matters is the distance to the competing phases. 17 meV/atom is close to the median for known metastable materials, so AB₂ stays on the shortlist.
Reconciling two databases

A candidate oxide is reported as 0 meV/atom in Materials Project but −12 meV/atom in OQMD.
- 01Recognise that OQMD’s “stability” field is signed: a negative value means the phase is on the hull and 12 meV/atom below the hull formed by the other phases.
- 02Clamp the OQMD value at 0 for comparison: both sources agree the compound is on the hull.
- 03Note the margin: 12 meV/atom below its neighbours is small compared with typical DFT correction uncertainties, so stability is plausible but not overwhelming.
- 04Check whether both databases use the same structure (same space group) — a different polymorph can explain disagreements.
Know each database’s sign convention before comparing. A raw −12 next to a 0 looks like disagreement when it is actually agreement.
When entropy pays the bill
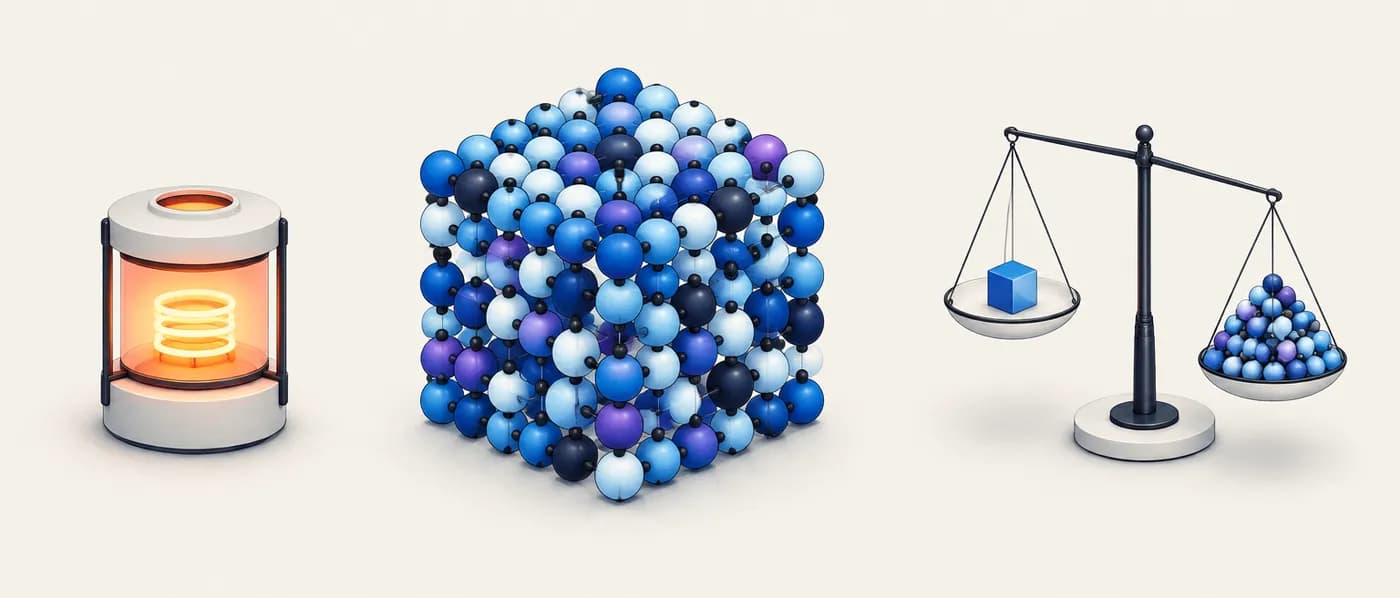
The rock-salt oxide (Mg,Co,Ni,Cu,Zn)O, reported by Rost et al. (2015), forms a single phase at high temperature even though it is not the lowest-enthalpy arrangement.
- 01Ideal configurational entropy for five cations mixed equally on one sublattice: S = k_B ln 5 per cation ≈ 8.617×10⁻⁵ × 1.609 ≈ 1.39×10⁻⁴ eV/K per cation.
- 02Rock salt is half cations and half oxygen, so per atom S ≈ 6.9×10⁻⁵ eV/K.
- 03At 1,000 K, T·S ≈ 1,000 × 6.9×10⁻⁵ ≈ 0.069 eV/atom ≈ 69 meV/atom.
- 04An enthalpy penalty of a few tens of meV/atom can therefore be offset at synthesis temperature, and the phase can be retained by quenching.
For disordered and multi-component materials, read E_hull alongside an estimate of T·S at the intended synthesis temperature.
Rules of thumb for reading energy above hull (DFT, 0 K)
| E_hull (meV/atom) | Interpretation | Typical action |
|---|---|---|
| 0 | On the hull in this model | Strong candidate; still confirm across sources |
| 0–25 | Mildly metastable; common among known materials | Keep; most screens accept this band |
| 25–70 | Metastable; still within the range of many made materials | Keep only with a plausible stabilising mechanism |
| 70–100 | Clearly metastable | Low priority unless a specific route (pressure, epitaxy, kinetics) is planned |
| > 100 | Unlikely to form as a bulk equilibrium phase (some chemistries, such as nitrides, tolerate more) | Usually discard, or flag as a structure/calculation issue |
When to use it — and when not to
- Early screening of computed or hypothetical inorganic crystals.
- Ranking polymorphs or substitutions within one chemical system.
- Checking whether a predicted ML or DFT structure is plausible before ordering expensive calculations.
- Prioritising which candidates go to synthesis.
- Molecules, polymers, glasses and amorphous materials — the crystalline convex-hull picture does not apply directly.
- Comparing numbers taken from different databases or correction schemes without reconciliation.
- Systems where pressure, temperature or entropy dominate (high-pressure phases, strongly disordered alloys) unless those terms are added.
Common mistakes
Applying it in Lattice Graph
LatticeGraph brings hull distances from several computed databases into one search, so you can filter on stability and see whether independent sources agree before shortlisting.
- 01Search a composition or chemical system and filter or sort by energy above hull where the source reports it.
- 02Open the cross-source confidence view to compare the same material across databases; OQMD’s signed stability is treated as 0 for on-hull phases.
- 03Check for an experimental structure (for example from COD) to see whether the phase has been made.
- 04Carry the shortlist into property and synthesis checks.
Frequently asked questions
Is a compound with E_hull = 0 guaranteed to exist?
No. It is the lowest-energy option in the model at 0 K, but the model may be missing phases, use an approximate functional, or ignore temperature and kinetics. It is a strong signal, not a guarantee.
What cut-off should I use?
There is no universal value. Many teams use 25–50 meV/atom for early screens and tighten later. Sun et al. (2016) found that about half of synthesised compounds in the Materials Project are metastable, with a median hull distance among those of about 15 meV/atom and a 90th percentile of about 67 meV/atom — higher in some chemistries, such as nitrides.
Why do databases disagree about the same compound?
Different functionals, Hubbard U values, empirical energy corrections, reference phases and structures. Disagreement is information — check the structure and settings before trusting either number.
Does E_hull tell me anything about kinetics or synthesis?
Not directly. A metastable phase can be easy to make if a low-temperature route avoids its decomposition products; a stable phase can be hard to make if diffusion is slow.
References & further reading
- [1]Sun, W. et al. (2016). The thermodynamic scale of inorganic crystalline metastability. Science Advances 2, e1600225.Distribution of hull distances for experimentally known compounds; source of the ~15 meV/atom median and ~67 meV/atom 90th percentile for metastable phases.
- [2]Bartel, C. J. (2022). Review of computational approaches to predict the thermodynamic stability of inorganic solids. Journal of Materials Science 57, 10475–10498.Accessible review of convex hulls, decomposition energy and their limits.
- [3]Rost, C. M. et al. (2015). Entropy-stabilized oxides. Nature Communications 6, 8485.The (Mg,Co,Ni,Cu,Zn)O example of configurational entropy stabilisation.
- [4]Jain, A. et al. (2013). Commentary: The Materials Project: A materials genome approach to accelerating materials innovation. APL Materials 1, 011002.Background on the Materials Project database and its phase diagrams.
- [5]Wang, A. et al. (2021). A framework for quantifying uncertainty in DFT energy corrections. Scientific Reports 11, 15496.Energy correction scheme (MP2020) and its uncertainties.