What it is
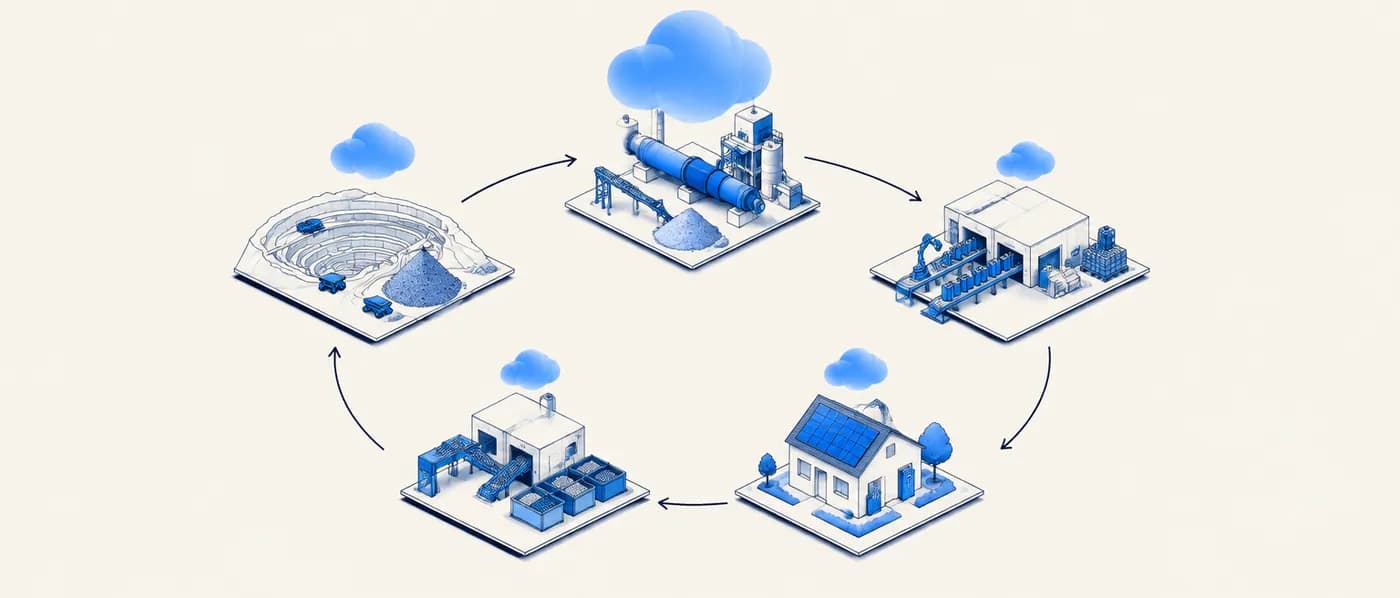
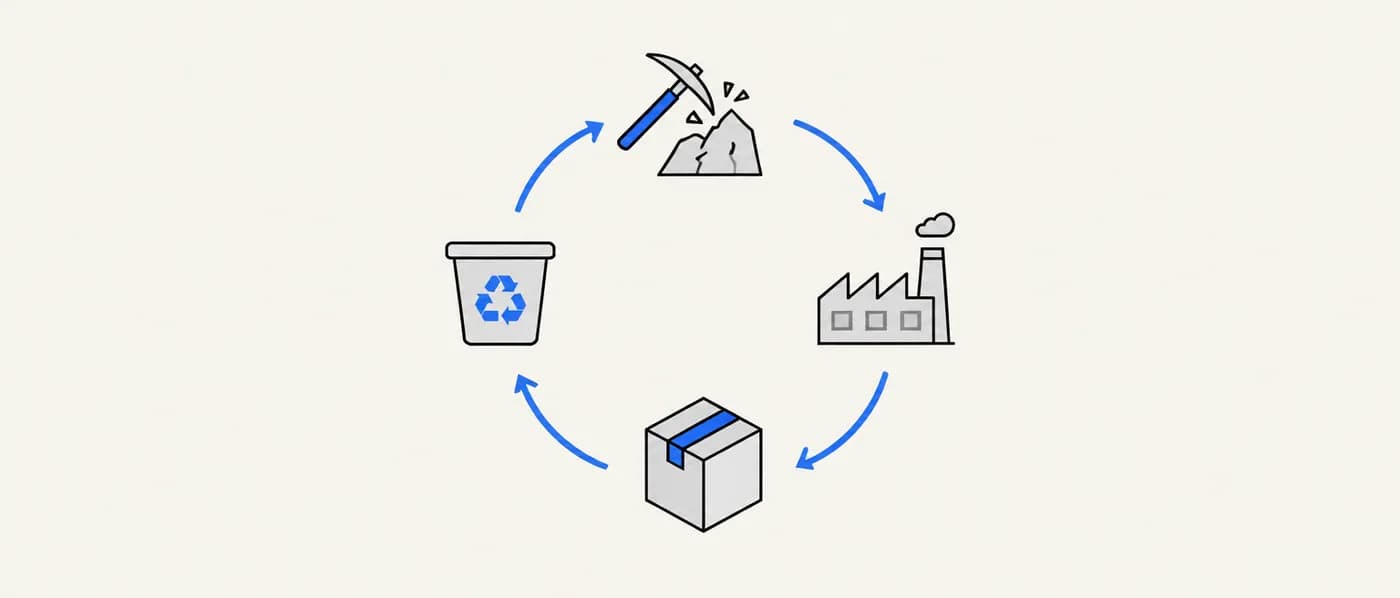
Life-cycle assessment (LCA) is a structured method for quantifying the environmental impacts of a product or process across its life: raw material extraction, processing, manufacturing, use and end of life. The international standards ISO 14040 and ISO 14044 (both 2006, with amendments) define how an LCA is framed, carried out and reported.
An LCA has four phases. Goal and scope sets the question, the functional unit and the system boundary. Life-cycle inventory (LCI) collects the inputs and outputs of every process in the boundary: materials, energy, emissions and waste. Life-cycle impact assessment (LCIA) converts those flows into impact indicators such as global warming potential (kg CO₂-equivalent), acidification or water use, using a chosen method. Interpretation checks the results for consistency and sensitivity and draws conclusions.
For new materials, full LCAs are rarely possible at the start because process data doesn’t exist yet. Teams instead use screening or prospective LCA: approximate inventories built from lab procedures, analogous industrial processes and databases, refined as the process matures. The value lies less in an exact number than in finding the hotspots that design choices can still change.
Why it matters for R&D decisions
Customers, regulators and investors increasingly ask for the carbon and environmental footprint of materials, and in some sectors (for example, batteries in the EU) footprint declarations are becoming mandatory. Most of a material’s footprint is set by early choices: chemistry, precursors, synthesis temperature, solvent and energy source. A screening LCA during R&D shows which of those choices dominate, while they are still cheap to change, and stops teams from claiming a “greener” material that is only greener per kilogram.
The formula
Impactₖ = Σⱼ CFₖ,ⱼ × mⱼ (per functional unit)
- Impactₖ
- Result for impact category k, e.g. global warming potential in kg CO₂e per functional unit.
- mⱼ
- Amount of elementary flow j (e.g. kg CO₂, kg CH₄ emitted) from the inventory, scaled to one functional unit.
- CFₖ,ⱼ
- Characterisation factor converting flow j into category k (e.g. kg CO₂e per kg CH₄ from the IPCC 100-year global warming potentials).
Inventory flows come from process data or databases. Characterisation factors come from the chosen impact-assessment method (for example IPCC GWP100, ReCiPe or the EU Environmental Footprint method). Always report which method and version you used.
How to apply it, step by step
- 1Define the goal and functional unit
State the question (for example, “which cathode has the lower climate impact for an EV battery?”) and a functional unit that captures the function delivered, such as 1 kWh of energy delivered over the battery’s life, not 1 kg of material.
- 2Set the system boundary
Choose cradle-to-gate (raw materials to factory gate), cradle-to-grave (adds use and end of life) or cradle-to-cradle (adds recycling back into production). For an R&D comparison, cradle-to-gate is common, but only if the use phase is the same for all candidates.
- 3Build the inventory
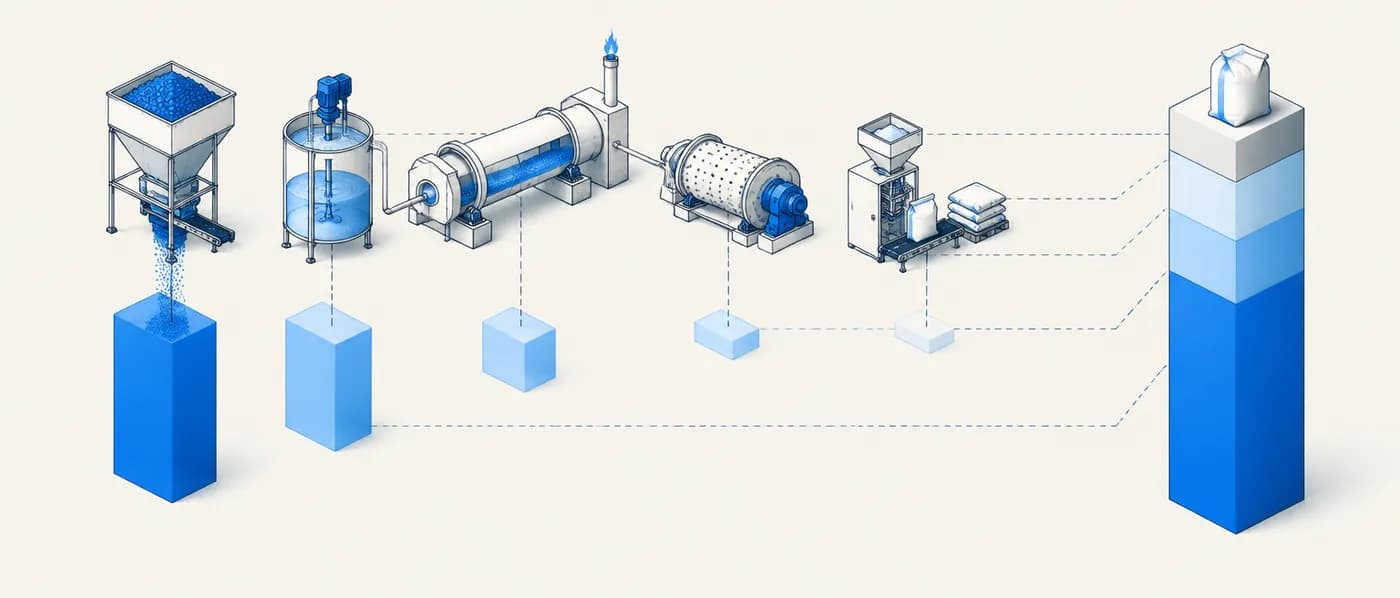
List every input per functional unit: precursors, solvents, energy for each step, yields and losses. Use lab procedures scaled with engineering judgement, and database processes for upstream materials. Note data quality for each entry.
- 4Choose the impact method and categories
At minimum report climate change (kg CO₂e, GWP100). Add categories relevant to the material: water use, acidification, resource depletion, toxicity. Use one method consistently across candidates.
- 5Handle multi-output processes
When a process makes several products (for example, a mine producing copper and cobalt), allocate burdens by mass, economic value or physical relationship, or expand the system. Test how sensitive the result is to that choice.
- 6Interpret with sensitivity analysis
Vary the largest assumptions (electricity grid, yield, solvent recovery, allocation) and report ranges. Identify hotspots and what design change would reduce them.
Worked examples
Per kg versus per kWh delivered: two battery cathodes (hypothetical)
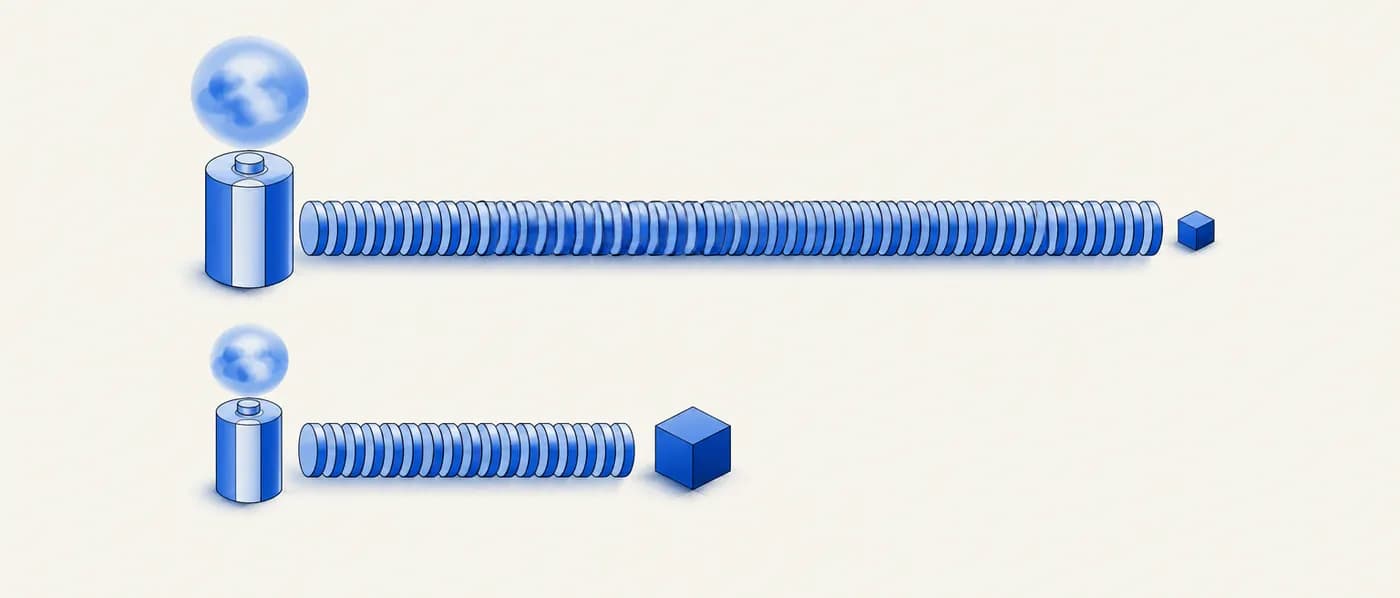
Two cathode options for the same stationary-storage cell. Footprints and cycle lives are hypothetical, for illustration. Other cell components are assumed identical.
- 01Option A: 60 kg CO₂e per kWh of cell capacity; 3,000 full-equivalent cycles.
- 02Option B: 45 kg CO₂e per kWh of cell capacity; 1,000 full-equivalent cycles.
- 03Per kWh of capacity, B looks 25% better (45 vs 60).
- 04Per kWh delivered over life (ignoring efficiency and depth-of-discharge differences): A = 60 ÷ 3,000 = 0.020 kg CO₂e/kWh; B = 45 ÷ 1,000 = 0.045 kg CO₂e/kWh.
The functional unit decides the answer. A material that is “greener per kg” can be worse per unit of service.
Grid electricity dominates an energy-intensive synthesis
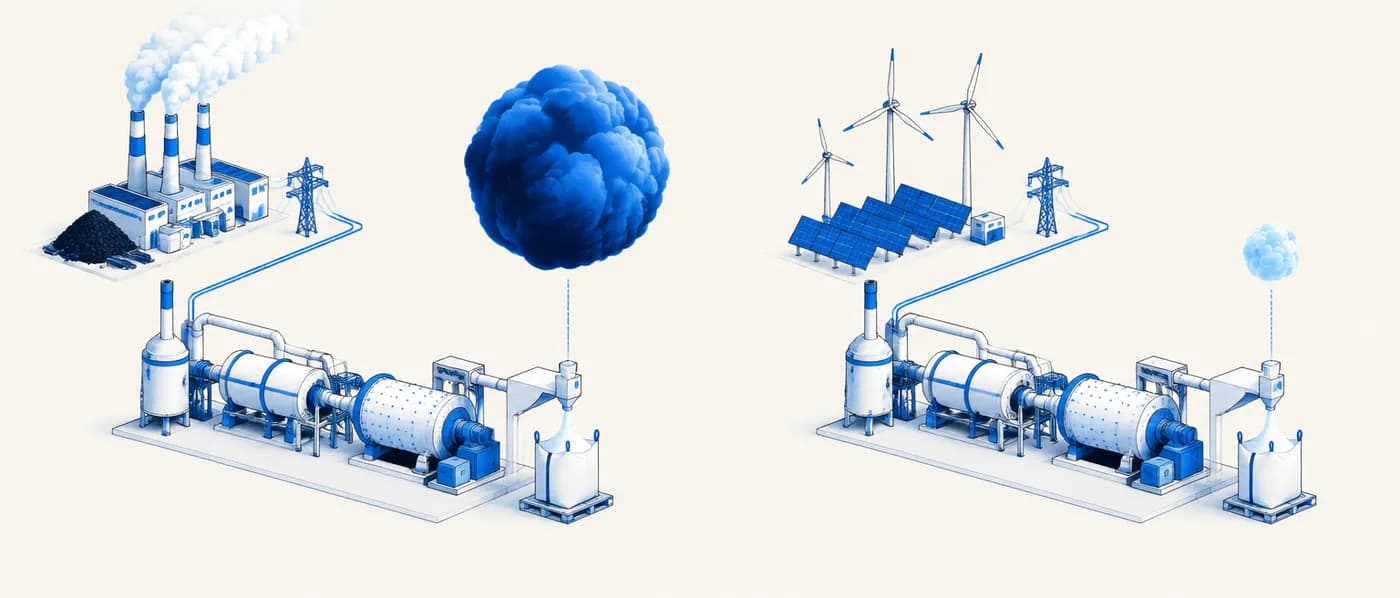
A ceramic powder needs 20 kWh of electricity per kg for calcination and milling. Grid intensities are illustrative round numbers.
- 01Coal-heavy grid at ~0.6 kg CO₂e/kWh: 20 × 0.6 = 12 kg CO₂e per kg from electricity.
- 02Low-carbon grid at ~0.1 kg CO₂e/kWh: 20 × 0.1 = 2 kg CO₂e per kg from electricity.
- 03Difference: 10 kg CO₂e per kg from location alone, before any change to the chemistry.
- 04Sensitivity conclusion: report results for each plausible production location, and target lower calcination energy as an R&D lever.
For energy-intensive processes, state the electricity assumption explicitly. It often matters more than the material choice.
Allocation for a by-product metal (hypothetical)
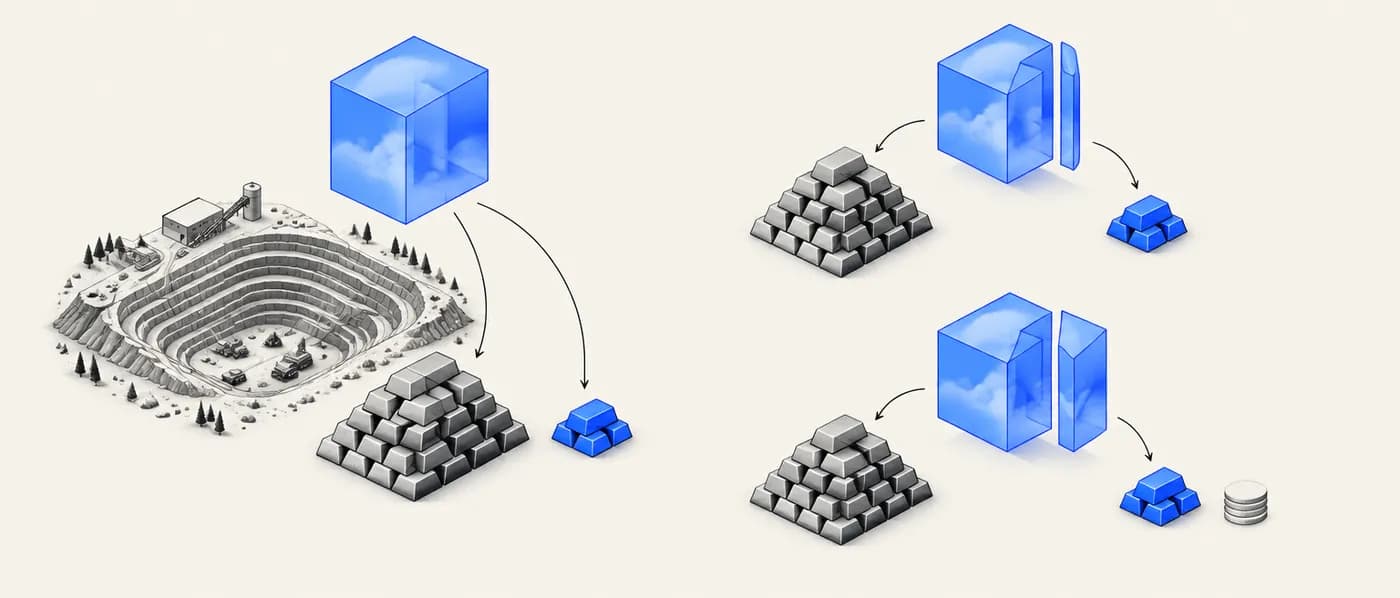
A hypothetical mine produces 100 t of copper and 5 t of cobalt per period, with total emissions of 1,000 t CO₂e. Prices are hypothetical: copper $9,000/t, cobalt $30,000/t.
- 01Mass allocation: cobalt share = 5 ÷ 105 ≈ 4.76% → 1,000 × 0.0476 ≈ 47.6 t CO₂e → 47.6 ÷ 5 ≈ 9.5 t CO₂e per t Co.
- 02Economic allocation: revenue copper = 100 × 9,000 = $900,000; cobalt = 5 × 30,000 = $150,000; cobalt share = 150,000 ÷ 1,050,000 ≈ 14.3%.
- 03→ 1,000 × 0.143 ≈ 142.9 t CO₂e → 142.9 ÷ 5 ≈ 28.6 t CO₂e per t Co.
- 04Economic allocation assigns about three times the burden of mass allocation to cobalt.
Never compare two LCAs that used different allocation rules without saying so. ISO 14044 prefers avoiding allocation where possible, then physical relationships, then other relationships such as economic value.
System boundaries at a glance
| Boundary | Includes | Typical use in R&D |
|---|---|---|
| Cradle-to-gate | Extraction → material processing → factory gate | Comparing materials with an identical use phase |
| Gate-to-gate | One process step or plant only | Optimising a single synthesis or processing step |
| Cradle-to-grave | Adds use phase and end of life | Products whose lifetime or efficiency differs |
| Cradle-to-cradle | Adds recycling back into new production | Recyclable materials and circularity claims |
When to use it — and when not to
- Comparing candidate materials or synthesis routes on environmental impact before scale-up.
- Finding hotspots (a solvent, a high-temperature step, an energy source) that R&D can still change.
- Preparing footprint data that customers or regulations require.
- Testing a “greener” claim before it goes into marketing material.
- To make public comparative claims based on a screening LCA. ISO 14044 requires critical review for comparative assertions disclosed to the public.
- When inventory data is so uncertain that the ranges overlap completely. Improve the data first, or report the result as inconclusive.
- As the only decision criterion. Combine it with performance, cost, supply and IP.
Common mistakes
Applying it in Lattice Graph
Use LatticeGraph to keep life-cycle context alongside performance as you narrow candidates, and to record the assumptions behind any footprint estimate.
- 01Shortlist candidates and open the sustainability view to see an estimated CO₂ footprint for each published synthesis route, built from openLCA carbon-intensity factors for each processing step. Treat it as a screening figure, not a full LCA.
- 02Pull synthesis routes for each candidate from recipe data to draft the inventory: precursors, temperatures and steps.
- 03Map inventory steps to LCA process data for upstream burdens (openLCA or another database), and record the functional unit, boundary and allocation rule.
- 04Save results with their assumptions in your evidence pack so reviewers can reproduce or challenge them.
Frequently asked questions
Do I need a full ISO-compliant LCA during R&D?
Usually not at first. A screening LCA that follows the ISO structure, with clearly stated assumptions, is enough to compare options and find hotspots. Move to a full study, with critical review, before making public comparative claims.
What functional unit should I use for a battery material?
Common choices are per kWh of storage capacity, or per kWh delivered over the battery’s life. The second is better when candidates differ in cycle life or efficiency.
Which impact method should I use?
Any recognised method used consistently, such as IPCC GWP100 for climate, ReCiPe or the EU Environmental Footprint method for wider categories. Always state the method and version.
Where does inventory data come from?
Primary data from your own process where possible; otherwise LCA databases and software such as openLCA, plus literature and engineering estimates. Record data quality for each entry.
References & further reading
- [1]ISO 14040:2006. Environmental management — Life cycle assessment — Principles and framework. International Organization for Standardization.Defines the LCA framework and four phases.
- [2]ISO 14044:2006. Environmental management — Life cycle assessment — Requirements and guidelines. International Organization for Standardization.Requirements, including the allocation hierarchy and critical review for public comparative assertions.
- [3]European Commission, Joint Research Centre (2010). International Reference Life Cycle Data System (ILCD) Handbook — General guide for Life Cycle Assessment — Detailed guidance.Detailed practical guidance on applying the ISO standards.
- [4]Forster, P. et al. (2021). The Earth’s Energy Budget, Climate Feedbacks, and Climate Sensitivity. In: Climate Change 2021: The Physical Science Basis (IPCC AR6 WG1), Chapter 7.Source of current 100-year global warming potentials.
- [5]Ciez, R. E., & Whitacre, J. F. (2019). Examining different recycling processes for lithium-ion batteries. Nature Sustainability, 2, 148–156.Example of LCA applied to battery materials and recycling routes.