What it is
The Herfindahl–Hirschman Index measures how concentrated a market is. You take the market share of each producer, expressed as a percentage, square it, and add the squares. Squaring gives big producers much more weight than small ones, so a market with one dominant supplier scores far higher than one with many equal suppliers.
The index is named after Orris Herfindahl, who used it in a 1950 study of the steel industry, and Albert Hirschman, who proposed a similar measure in 1945 to study the concentration of trade. Competition authorities use it to judge whether a merger concentrates a market too much. In materials and supply-chain analysis, the same arithmetic is applied to producing countries or companies to measure how exposed supply is to a single point of failure.
HHI is one of the inputs to formal criticality assessments, including the European Commission’s supply-risk score. Used on its own, it gives a fast, transparent and reproducible number for comparing elements, intermediates or whole candidate materials.
Why it matters for R&D decisions
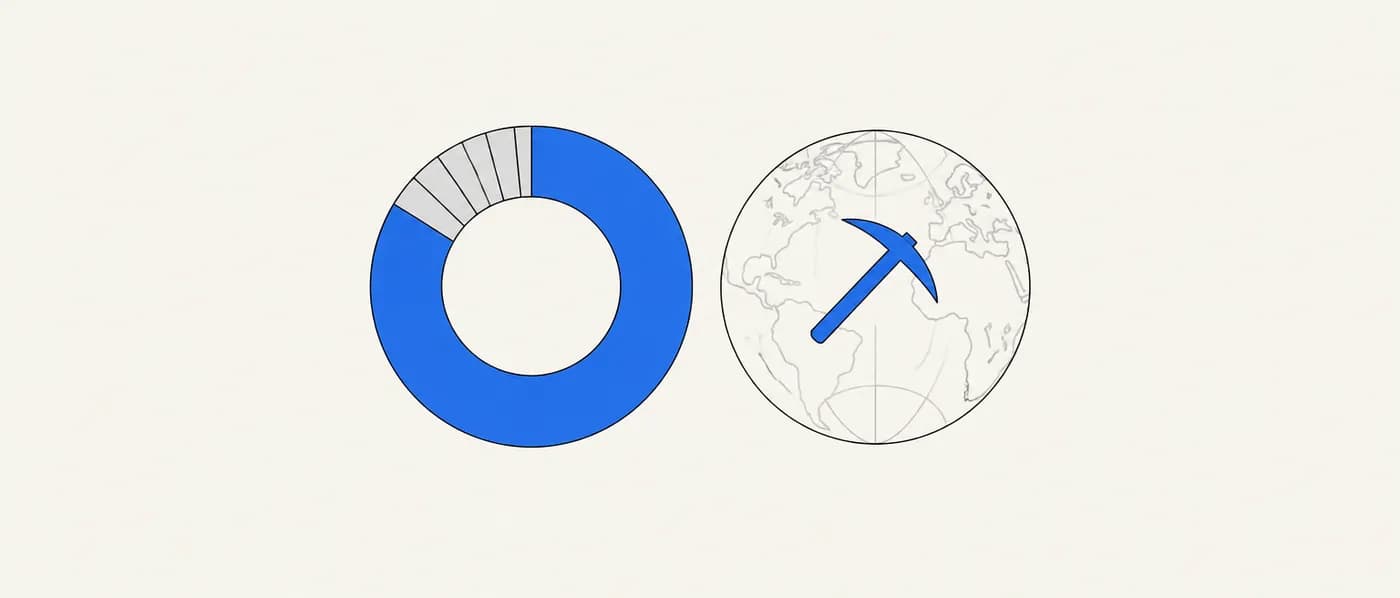
When a single country or company controls most of an input, any policy change, outage or price move there flows straight into your product. HHI turns that exposure into a number you can compare across candidates and track over time. It is quick to compute from public production statistics, easy to explain, and reveals differences that “is it on the critical list?” cannot, such as two critical elements with very different degrees of concentration.
The formula
HHI = Σ sᵢ² (sᵢ in %, range 0–10,000) Effective number of producers ≈ 10,000 ÷ HHI
- sᵢ
- Market share of producer i, as a percentage of total production (country or company level).
- Σ
- Sum over all producers. Small producers contribute little, so a reasonable “others” approximation is usually fine.
- 10,000 ÷ HHI
- The number of equal-sized producers that would give the same HHI. A useful plain-language translation.
Some sources use shares as fractions (0–1), which gives an HHI between 0 and 1. Multiply by 10,000 to convert. Always state which convention you use.
How to apply it, step by step
- 1Pick the stage of the supply chain
Decide whether you are measuring mine production, refining, or a specific intermediate (for example, battery-grade lithium hydroxide). Compute separately for each stage that matters to you.
- 2Get production shares
Use public statistics such as USGS Mineral Commodity Summaries or national geological surveys. Note the year. Convert tonnes to percentage shares of the world total.
- 3Square and sum
Square each share in percent and add them. Group small producers into an “others” line only if their shares are small; a group of many 1% producers contributes very little.
- 4Translate and compare
Convert to an effective number of producers (10,000 ÷ HHI) and compare against thresholds. Above 2,500 (or 1,800 under the 2023 US merger guidelines) is highly concentrated.
- 5Roll up to the material
For a multi-element material, report the worst element HHI and list each element’s HHI. Averaging hides the bottleneck.
Worked examples
Four equal producers
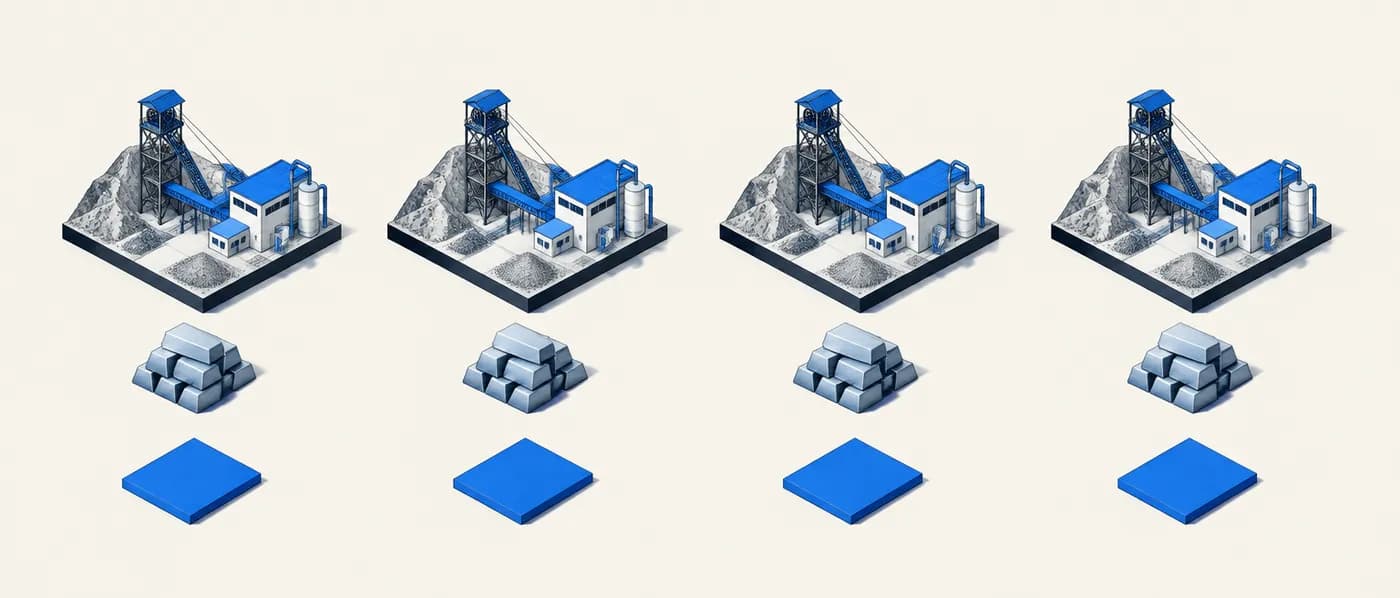
A simple calibration case: four countries each produce 25% of an element.
- 01Shares: 25, 25, 25, 25.
- 02Squares: 625 + 625 + 625 + 625.
- 03HHI = 2,500.
- 04Effective number of producers = 10,000 ÷ 2,500 = 4.
Even a market that sounds diverse can be concentrated by this measure. Fewer than about four equal-sized producers already counts as high concentration.
Cobalt mine supply (illustrative shares)
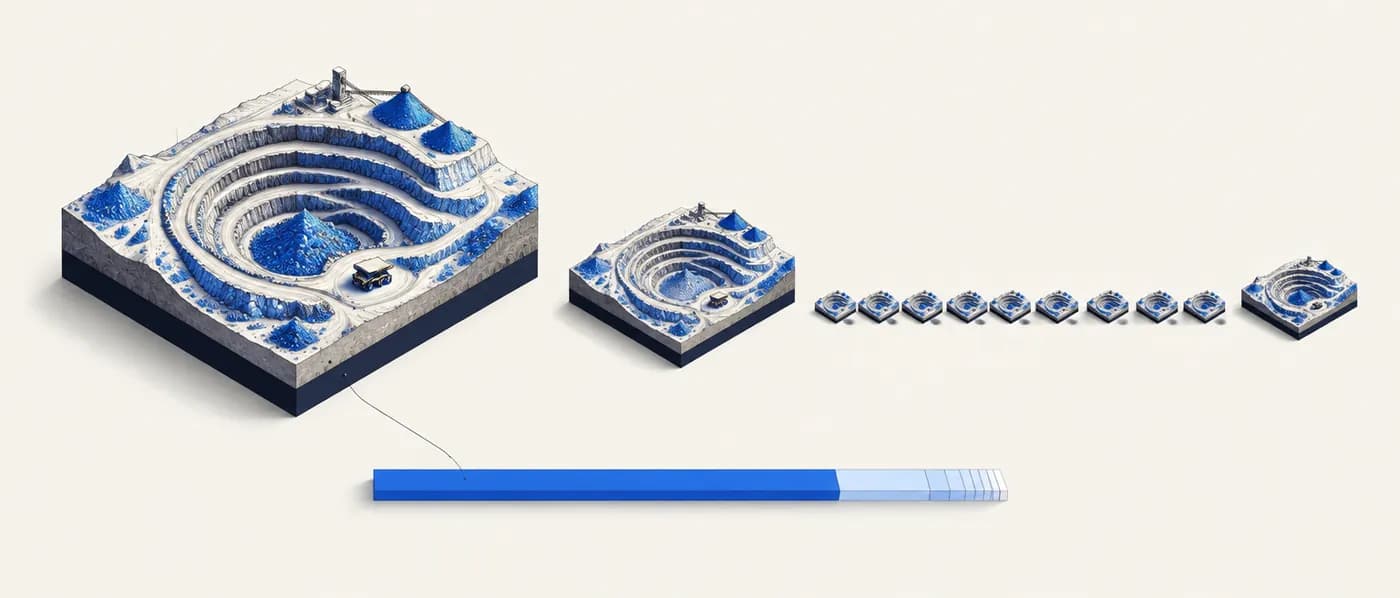
Rounded shares based on USGS Mineral Commodity Summaries 2026 estimates for 2025 mine production (Congo (Kinshasa) about 73–74%, Indonesia about 14%), with the remaining producers simplified. Check the latest edition before reusing the numbers.
- 01Illustrative shares (%): 74, 14, 2, plus ten producers at 1% each (total 100).
- 02Squares: 74² = 5,476; 14² = 196; 2² = 4; 1² × 10 = 10.
- 03HHI = 5,476 + 196 + 4 + 10 = 5,686.
- 04Effective number of producers = 10,000 ÷ 5,686 ≈ 1.8.
The dominant share drives almost the whole index: 5,476 of 5,686 comes from one country. Diversifying away from that producer is what moves the number.
Comparing two candidate cathodes by worst-element HHI
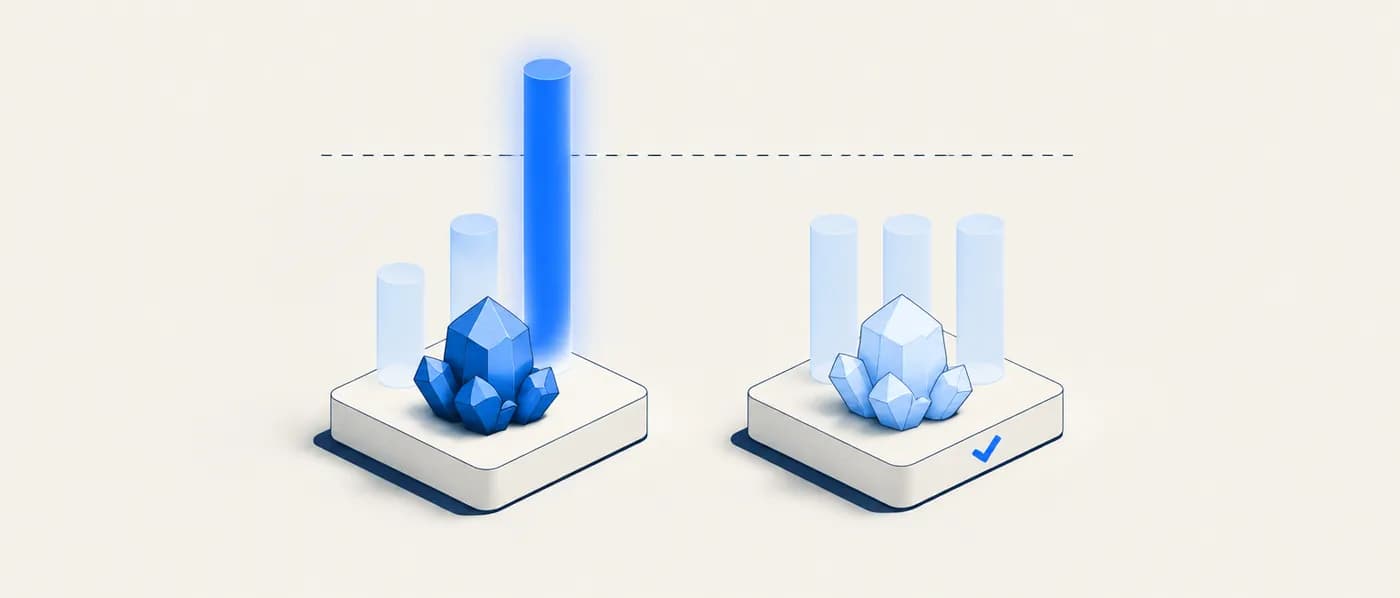
A team compares two hypothetical cathode compositions using element-level HHIs they computed for refined supply. All values are hypothetical.
- 01Candidate A contains elements with refined-supply HHIs of 1,200, 1,900 and 5,800.
- 02Candidate B contains elements with refined-supply HHIs of 1,200, 2,300 and 2,600.
- 03Average HHI: A = (1,200 + 1,900 + 5,800) ÷ 3 ≈ 2,970; B = (1,200 + 2,300 + 2,600) ÷ 3 ≈ 2,030.
- 04Worst element: A = 5,800; B = 2,600.
- 05Report both, but use the worst element for the gate decision.
Supply fails at the weakest link. Report the worst element, not the average.
HHI thresholds and what they mean
| HHI | Effective producers | US DOJ/FTC 2010 guidelines | US 2023 Merger Guidelines |
|---|---|---|---|
| < 1,500 | > 6.7 | Unconcentrated | Below the high-concentration line |
| 1,500 – 1,800 | 5.6 – 6.7 | Moderately concentrated | Below the high-concentration line |
| 1,800 – 2,500 | 4 – 5.6 | Moderately concentrated | Highly concentrated |
| > 2,500 | < 4 | Highly concentrated | Highly concentrated |
| 10,000 | 1 | Monopoly | Monopoly |
When to use it — and when not to
- Comparing supply exposure of candidate materials at the shortlist stage.
- Feeding the supply-risk axis of a criticality matrix.
- Tracking how concentration changes year to year as new mines or refineries come online.
- Measuring your own supplier concentration (company-level shares of your purchases).
- As a full risk score on its own. It ignores governance, export controls, stockpiles, recycling and substitutability.
- When market-share data is very uncertain or years out of date. A precise-looking HHI on bad data misleads.
- To compare markets defined differently (for example, ore versus refined chemical) without saying so.
Common mistakes
Applying it in Lattice Graph
LatticeGraph lets you keep supply concentration next to each candidate’s properties, so a material’s worst-element exposure is visible when you shortlist it, not after.
- 01Shortlist candidates from materials search, then open the supply-risk view to see each element’s production HHI, top producer and share. The view reports HHI on the 0–1 scale; multiply by 10,000 to compare with the thresholds above.
- 02Check the source year behind each value, and compute your own HHI for refining or key intermediates where they matter, from the latest public statistics.
- 03Add the worst-element HHI and its source year to your evidence pack so reviewers can audit it.
- 04Use USGS deposit data (MRDS, USMIN) to discuss future diversification, but keep it separate from the current-production HHI.
Frequently asked questions
What HHI counts as risky for a raw material?
There is no official supply-risk threshold. Many analysts borrow the competition-policy lines: above 2,500 (or 1,800 under the 2023 US guidelines) is highly concentrated. Use them as reference points and state which one you use.
Should I use countries or companies?
Countries capture policy and geopolitical risk. Companies capture commercial and operational risk. For strategic screening, countries are the usual choice. For procurement, company-level HHI of your actual suppliers is more useful.
Why square the shares?
Squaring weights large producers more heavily, which matches the intuition that one 70% producer is far riskier than seven 10% producers. It also makes the index easy to compute and compare.
How does HHI relate to a criticality matrix?
HHI is one ingredient of the supply-risk axis. A full criticality assessment adds importance to your product, governance, recycling and substitution.
References & further reading
- [1]Herfindahl, O. C. (1950). Concentration in the Steel Industry. PhD dissertation, Columbia University.Origin of the Herfindahl index.
- [2]Hirschman, A. O. (1945). National Power and the Structure of Foreign Trade. University of California Press.Early concentration index applied to trade.
- [3]U.S. Department of Justice and Federal Trade Commission (2010). Horizontal Merger Guidelines.Thresholds of 1,500 and 2,500.
- [4]U.S. Department of Justice and Federal Trade Commission (2023). Merger Guidelines.Highly concentrated threshold lowered to 1,800.
- [5]U.S. Geological Survey. Mineral Commodity Summaries (annual).Country-level mine production data used to compute shares.
- [6]European Commission (2023). Study on the Critical Raw Materials for the EU 2023 – Final Report.Uses a governance-weighted HHI inside the supply-risk score.