What it is
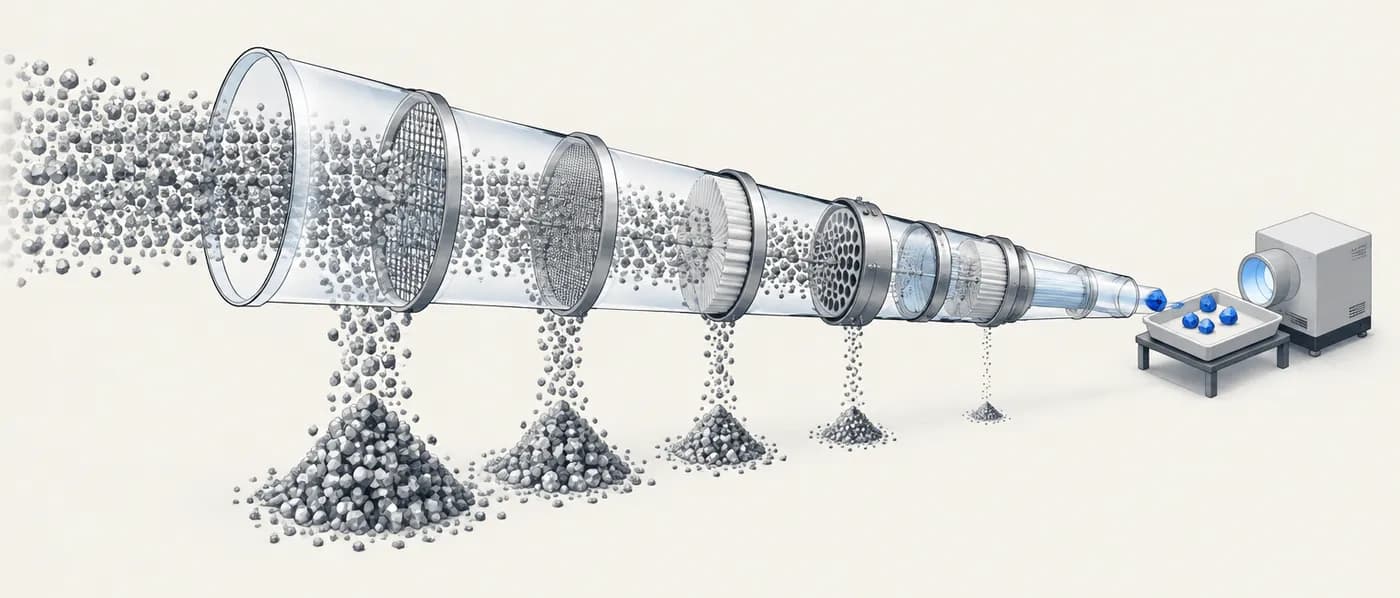
“Battery basics” is not one named rule but a set of first-principles checks every battery materials team runs before investing in a candidate. They come straight from Faraday’s law and the thermodynamics of an electrochemical cell, so they need nothing more than a formula, a molar mass and an estimate of the redox voltage.
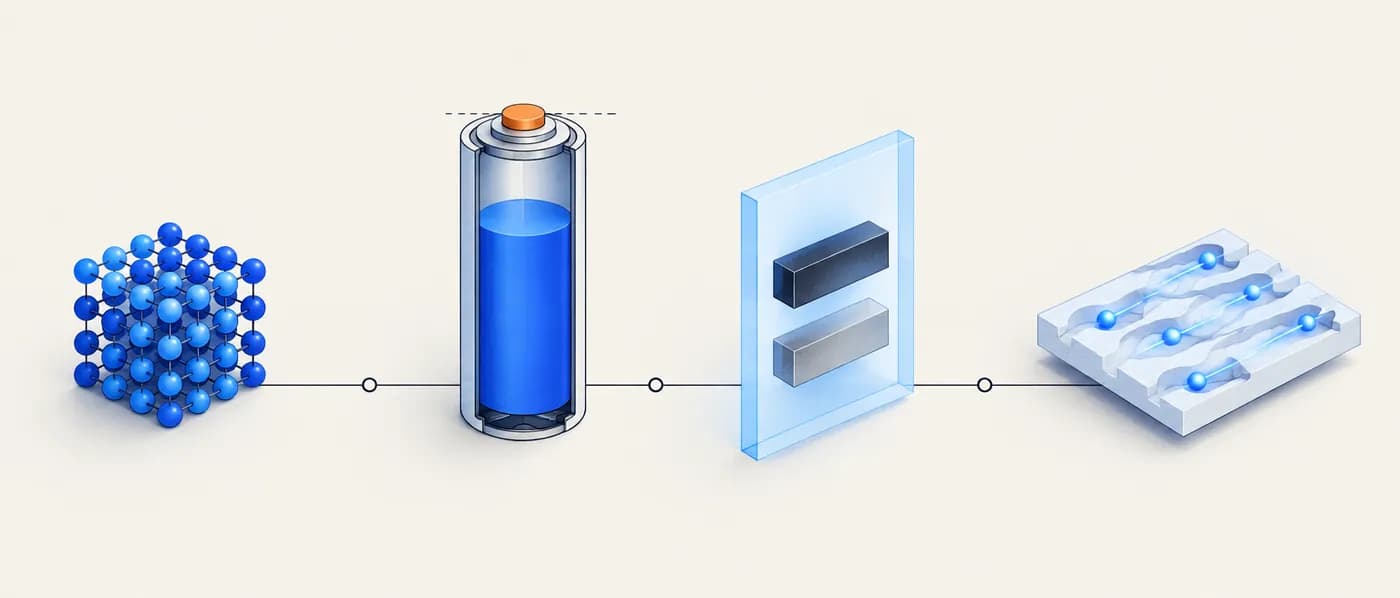
The first two checks, theoretical capacity and theoretical energy, tell you the best a material could ever do. The third, the electrolyte stability window, tells you whether the electrode potentials are compatible with the electrolyte or will decompose it. The fourth, ionic conductivity, tells you whether ions can move fast enough for useful power. A candidate that fails any one of these needs a clear reason to stay on the list.
These are ceilings and screens, not predictions of cell performance. Real cells lose capacity to incomplete lithium extraction, structural limits, side reactions and inactive components such as current collectors, binder, separator, electrolyte and casing. The basics tell you where the ceiling is so you can judge how far below it a real cell will land.
Why it matters for R&D decisions
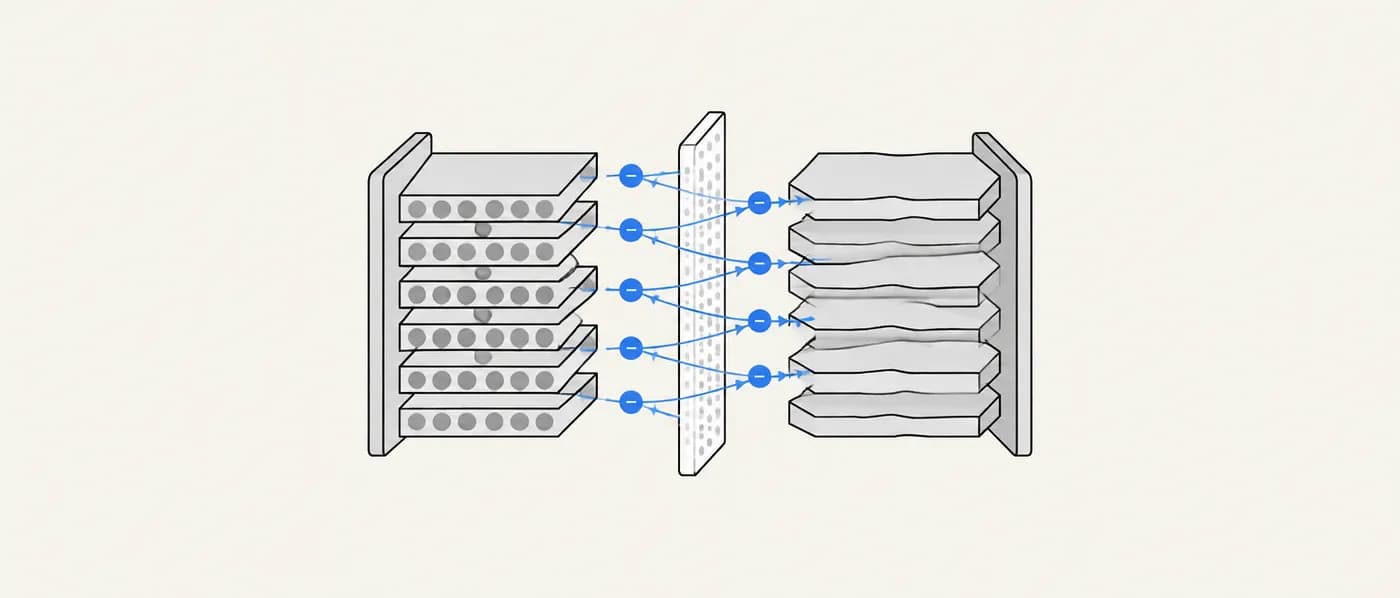
Battery projects fail expensively when a material is synthesised, coated and cycled before anyone checks that its ceiling is competitive. A two-minute capacity calculation can rule out a candidate that would never beat incumbents such as LiFePO₄ or NMC. A conductivity estimate can show that a solid electrolyte would add hundreds of millivolts of overpotential at realistic currents. Running the basics first keeps lab time for candidates that could win.
The formula
Q (mAh/g) = n · F / (3.6 · M) · Specific energy (Wh/kg) ≈ Q (mAh/g) × V_avg (V) · ASR (Ω·cm²) = L / σ
- Q
- Theoretical gravimetric capacity in mAh per gram of active material
- n
- Number of electrons (equivalently Li⁺ or Na⁺ ions) transferred per formula unit
- F
- Faraday constant, 96,485 C/mol
- 3.6
- Unit conversion: 1 mAh = 3.6 C
- M
- Molar mass of the formula unit in g/mol (by convention the delithiated or lithiated host, so state which)
- V_avg
- Average voltage of the redox reaction versus the counter electrode, usually Li/Li⁺
- L
- Thickness of the electrolyte or separator layer
- σ
- Ionic conductivity (S/cm)
Specific energy from Q × V is a material-level number, versus lithium metal and excluding every inactive component. Always label it “material level” or “theoretical”.
How to apply it, step by step
- 1Write the electrochemical reaction
Decide which ions move and how many electrons transfer per formula unit. For LiFePO₄ → FePO₄ + Li⁺ + e⁻, n = 1. For silicon alloying to Li₁₅Si₄, n = 3.75 per Si. Get n wrong and every later number is wrong.
- 2Compute theoretical capacity
Use Q = nF / (3.6 · M) with the molar mass of the host you are quoting. Graphite is conventionally quoted per gram of carbon (C₆), giving 372 mAh/g. Cathodes are usually quoted per gram of the lithiated phase.
- 3Estimate voltage and energy
Take the average voltage from computed intercalation voltages, measured curves for analogues, or known redox couples. Multiply by capacity for material-level specific energy. Compare against incumbents at the same level of approximation.
- 4Check the stability window
Place the anode and cathode potentials against the electrolyte’s electrochemical stability window. Potentials outside the window are only usable if a stable, ion-conducting interphase (SEI or CEI) forms. Flag them as needing interphase work.
- 5Check ionic transport
For electrolytes, compare room-temperature conductivity with the ~1 mS/cm bar. Convert to area-specific resistance (ASR = L/σ) at your intended thickness, and multiply by current density to get the voltage you will lose.
- 6Discount to practical
Apply a realistic utilisation (the fraction of theoretical capacity actually achieved), then cell-level dilution from inactive components. Only then compare with cell-level targets such as Wh/kg or Wh/L.
Worked examples
Theoretical capacity of LiFePO₄
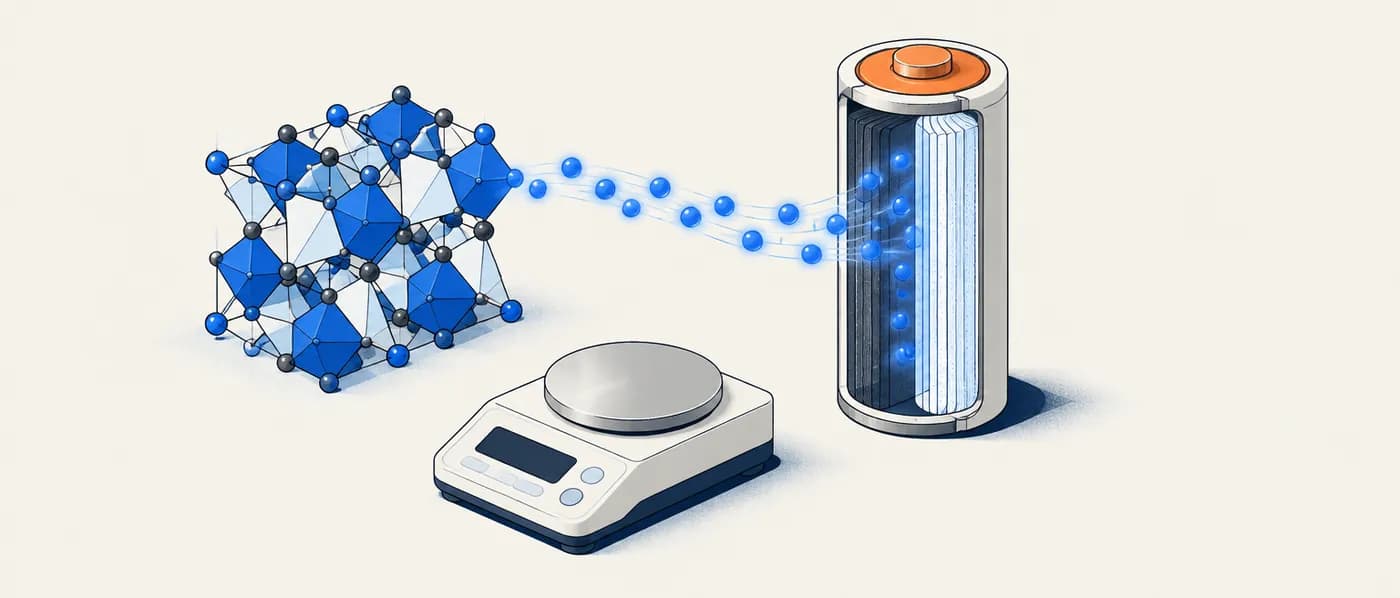
LiFePO₄ is the reference olivine cathode. Check its widely quoted ~170 mAh/g.
- 01Reaction: LiFePO₄ ⇌ FePO₄ + Li⁺ + e⁻, so n = 1.
- 02Molar mass: Li 6.94 + Fe 55.85 + P 30.97 + 4 × O 16.00 = 157.76 g/mol.
- 03Q = 1 × 96,485 / (3.6 × 157.76) = 96,485 / 567.9 ≈ 169.9 mAh/g.
- 04Average voltage ≈ 3.45 V vs Li/Li⁺ (the flat Fe²⁺/Fe³⁺ plateau).
- 05Material-level specific energy ≈ 170 × 3.45 ≈ 586 Wh/kg.
Commercial LFP cells deliver far less per kg of cell, because the cathode is only part of the cell mass. Quote material-level and cell-level numbers separately.
Comparing anode ceilings: graphite, silicon and lithium metal
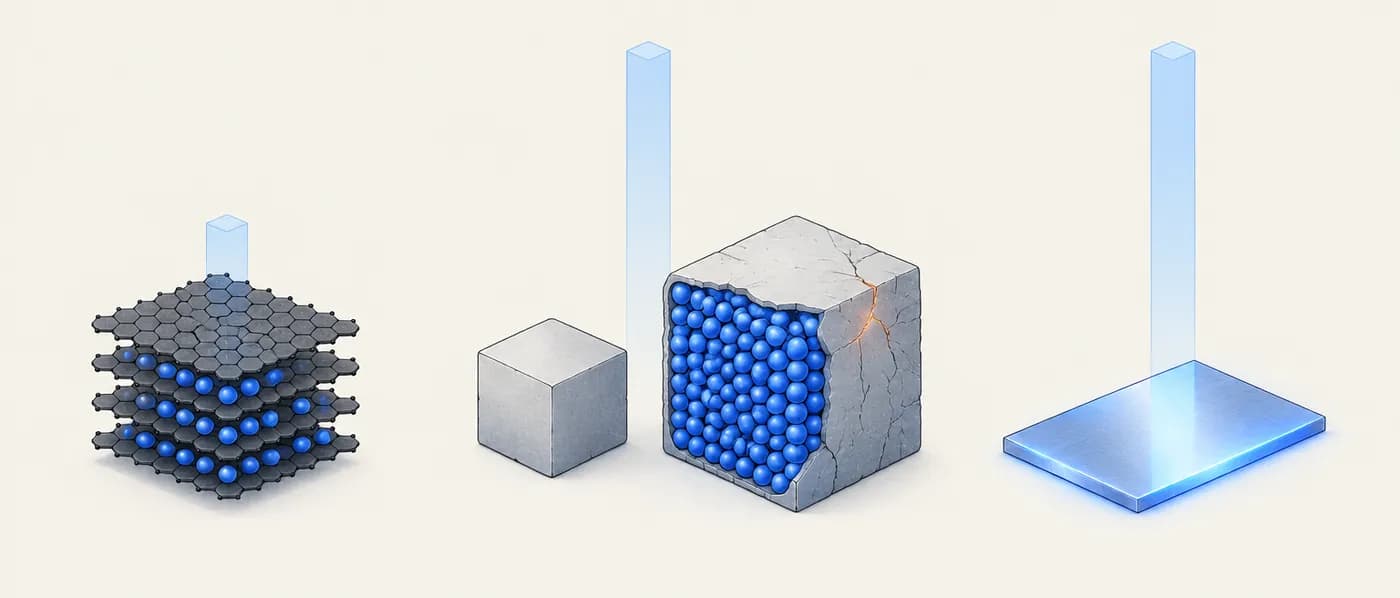
A team is weighing silicon-rich anodes against graphite and asks how large the capacity gap really is.
- 01Graphite (LiC₆, per gram of carbon): Q = 96,485 / (3.6 × 72.06) ≈ 372 mAh/g.
- 02Silicon to Li₁₅Si₄: n = 3.75 per Si, M = 28.09 g/mol → Q = 3.75 × 96,485 / (3.6 × 28.09) ≈ 3,579 mAh/g.
- 03Lithium metal: n = 1, M = 6.94 g/mol → Q = 96,485 / (3.6 × 6.94) ≈ 3,860 mAh/g.
- 04Note the hidden cost: silicon expands by roughly 280% in volume on full lithiation to Li₁₅Si₄, which drives particle cracking and SEI growth.
The capacity check says silicon is worth pursuing; the volume-change check says why it is hard. Run both before committing.
Is 0.1 mS/cm good enough for a solid electrolyte?
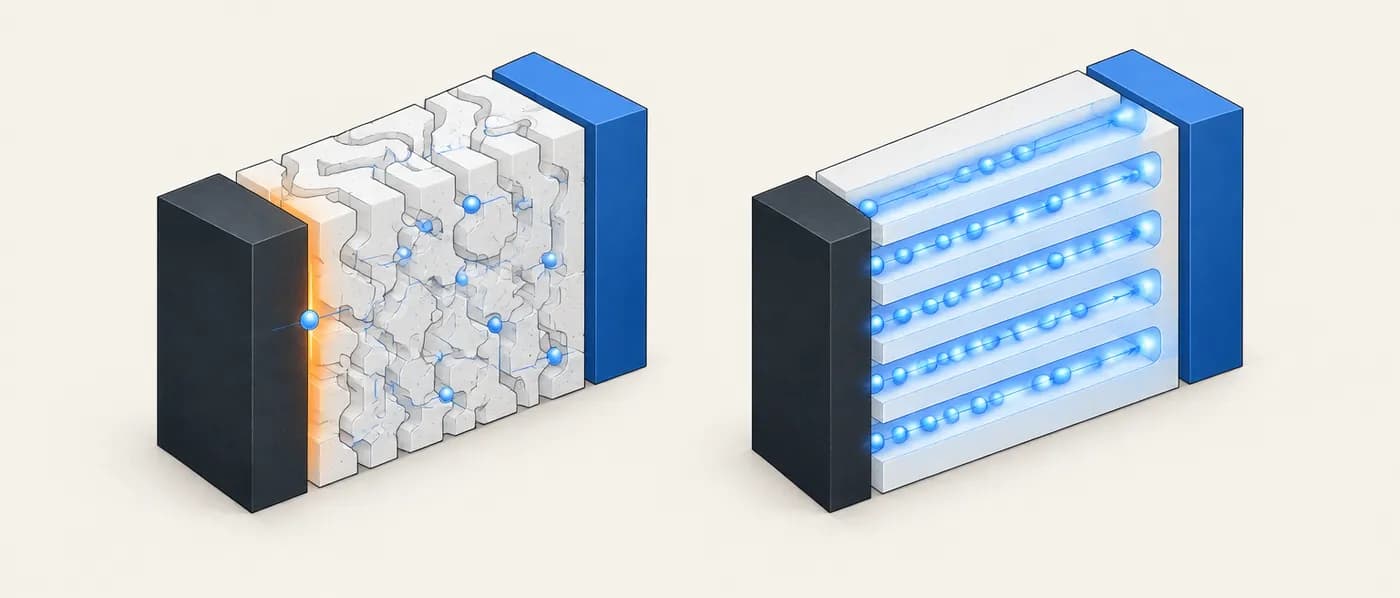
A candidate solid electrolyte measures 0.1 mS/cm at 25 °C. Compare it with a 1 mS/cm material as a 30 µm separator layer at 3 mA/cm² (roughly 1C for a 3 mAh/cm² electrode).
- 01Convert conductivity: 1 mS/cm = 1 × 10⁻³ S/cm; 0.1 mS/cm = 1 × 10⁻⁴ S/cm.
- 02Thickness L = 30 µm = 3 × 10⁻³ cm.
- 03ASR at 1 mS/cm = 3 × 10⁻³ / 1 × 10⁻³ = 3 Ω·cm². At 0.1 mS/cm: 30 Ω·cm².
- 04Voltage loss = current density × ASR: 3 × 10⁻³ A/cm² × 3 Ω·cm² = 9 mV, versus 90 mV at 0.1 mS/cm.
- 05Interfacial resistances often add more than the bulk term, so treat these as lower bounds.
The 1 mS/cm bar is not arbitrary. At practical thicknesses and currents it keeps bulk ohmic loss small next to other losses.
Theoretical capacities of common electrode materials (n as stated)
| Material | Role | n per formula unit | Molar mass (g/mol) | Theoretical Q (mAh/g) | Typical average V vs Li/Li⁺ |
|---|---|---|---|---|---|
| LiFePO₄ | Cathode | 1 | 157.76 | ≈ 170 | ≈ 3.4–3.45 |
| LiMn₂O₄ | Cathode | 1 | 180.81 | ≈ 148 | ≈ 4.0–4.1 |
| LiCoO₂ | Cathode | 1 (full) | 97.87 | ≈ 274 | ≈ 3.9 |
| LiNi₀.₈Mn₀.₁Co₀.₁O₂ (NMC811) | Cathode | 1 (full) | ≈ 97.3 | ≈ 275 | ≈ 3.7–3.8 |
| Graphite (LiC₆) | Anode | 1 per C₆ | 72.06 (C₆) | ≈ 372 | ≈ 0.1–0.2 |
| Si → Li₁₅Si₄ | Anode | 3.75 per Si | 28.09 | ≈ 3,579 | ≈ 0.4 |
| Li metal | Anode | 1 | 6.94 | ≈ 3,860 | 0 |
When to use it — and when not to
- First-pass screening of any proposed electrode or electrolyte before synthesis.
- Sanity-checking capacity, voltage or energy claims in papers, pitch decks and patents.
- Comparing candidates against incumbents on the same theoretical footing.
- Translating a conductivity measurement into a voltage loss at your cell design point.
- As a prediction of cycle life, rate capability or degradation. Those need cycling data.
- To claim cell-level Wh/kg without accounting for inactive components.
- For chemistries where n is uncertain or varies with state of charge (e.g. multi-step conversion reactions) without stating the assumption.
Common mistakes
Applying it in Lattice Graph
LatticeGraph’s battery workflow puts computed and measured battery data side by side, so the basics can be checked from inside a search session instead of a spreadsheet.
- 01Search by composition or class, then open candidates in the battery workflow to compare capacity, voltage and stability across the shortlist.
- 02For electrolytes, filter on measured room-temperature ionic conductivity and check the licence and provenance on each value.
- 03Use cycling datasets to see how analogous chemistries behave in real cells, keeping in mind that this is cell-level data that depends on format and protocol.
Frequently asked questions
Why does LiCoO₂ have a theoretical capacity of ~274 mAh/g but deliver much less?
Removing more than roughly half of the lithium destabilises the layered structure and the electrolyte at high voltage, so practical cells historically used about half the theoretical capacity. Modern coatings and dopants push the cutoff higher, but full delithiation is still not reversible.
Is 1 mS/cm a hard requirement for solid electrolytes?
It is a widely used rule of thumb, not a law. Thin layers and low current densities can tolerate lower conductivity; interfacial resistance often matters as much as bulk conductivity.
What sets the electrolyte stability window?
The potentials at which the electrolyte is reduced or oxidised. Goodenough and Kim framed this as the electrode electrochemical potentials needing to sit within the window, or else rely on a passivating solid-electrolyte interphase.
Can I use these formulas for sodium-ion batteries?
Yes. Faraday’s law is the same. Use sodium’s molar mass in the host formula and note that Na⁺ hosts typically have lower voltages and different structural limits.
References & further reading
- [1]Goodenough, J. B. & Kim, Y. (2010). Challenges for rechargeable Li batteries. Chemistry of Materials, 22(3), 587–603.Frames the electrolyte stability window and the role of passivating interphases.
- [2]Padhi, A. K., Nanjundaswamy, K. S. & Goodenough, J. B. (1997). Phospho-olivines as positive-electrode materials for rechargeable lithium batteries. Journal of the Electrochemical Society, 144(4), 1188–1194.Original LiFePO₄ cathode report.
- [3]Kamaya, N. et al. (2011). A lithium superionic conductor. Nature Materials, 10, 682–686.Li₁₀GeP₂S₁₂ with ~12 mS/cm at room temperature.
- [4]Murugan, R., Thangadurai, V. & Weppner, W. (2007). Fast lithium ion conduction in garnet-type Li₇La₃Zr₂O₁₂. Angewandte Chemie International Edition, 46, 7778–7781.Garnet LLZO solid electrolyte.
- [5]Obrovac, M. N. & Chevrier, V. L. (2014). Alloy negative electrodes for Li-ion batteries. Chemical Reviews, 114(23), 11444–11502.Silicon and alloy anode capacities and volume changes.