What it is
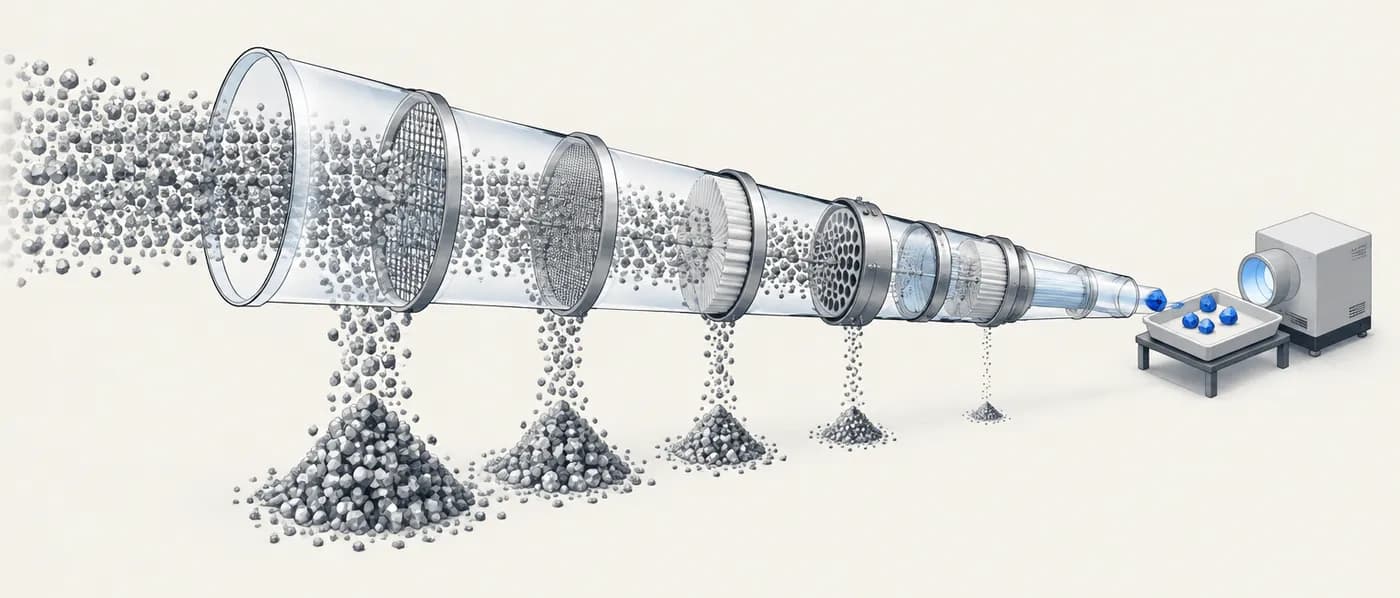
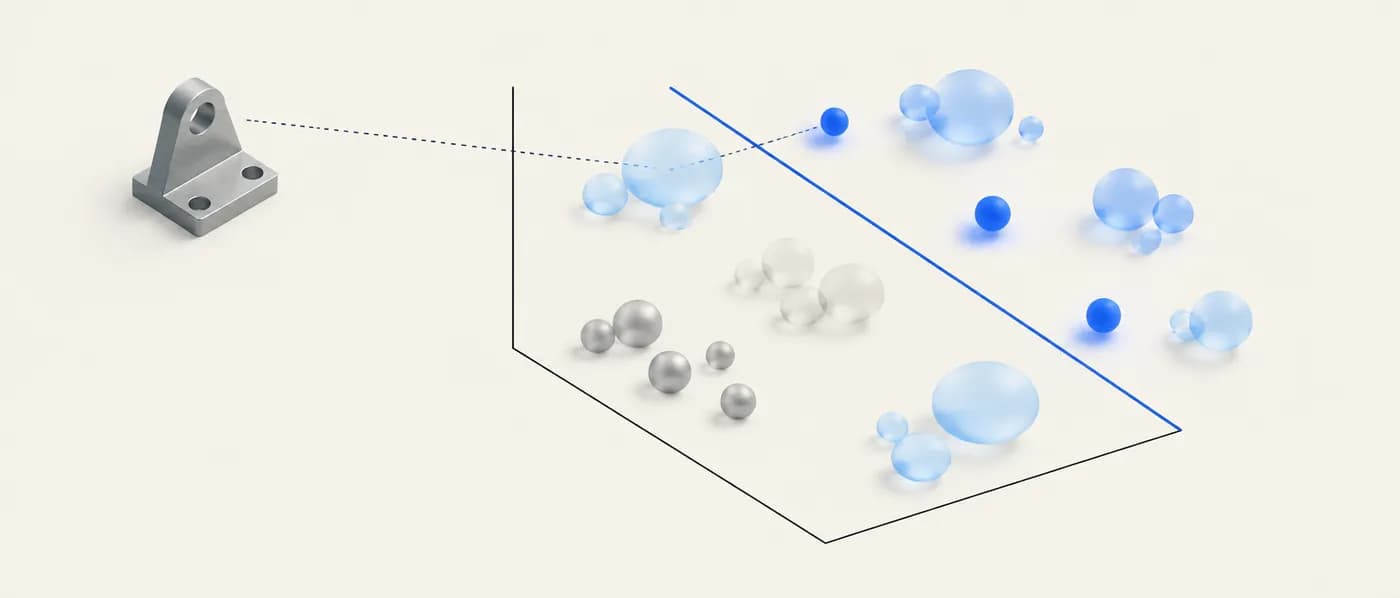
The Ashby method is a structured procedure for selecting materials, developed by Michael Ashby at the University of Cambridge and set out in his textbook Materials Selection in Mechanical Design. It replaces “which material do we usually use?” with an explicit chain of reasoning: what the component must do, what it must not violate, what you want to maximise or minimise, and what you are free to change.
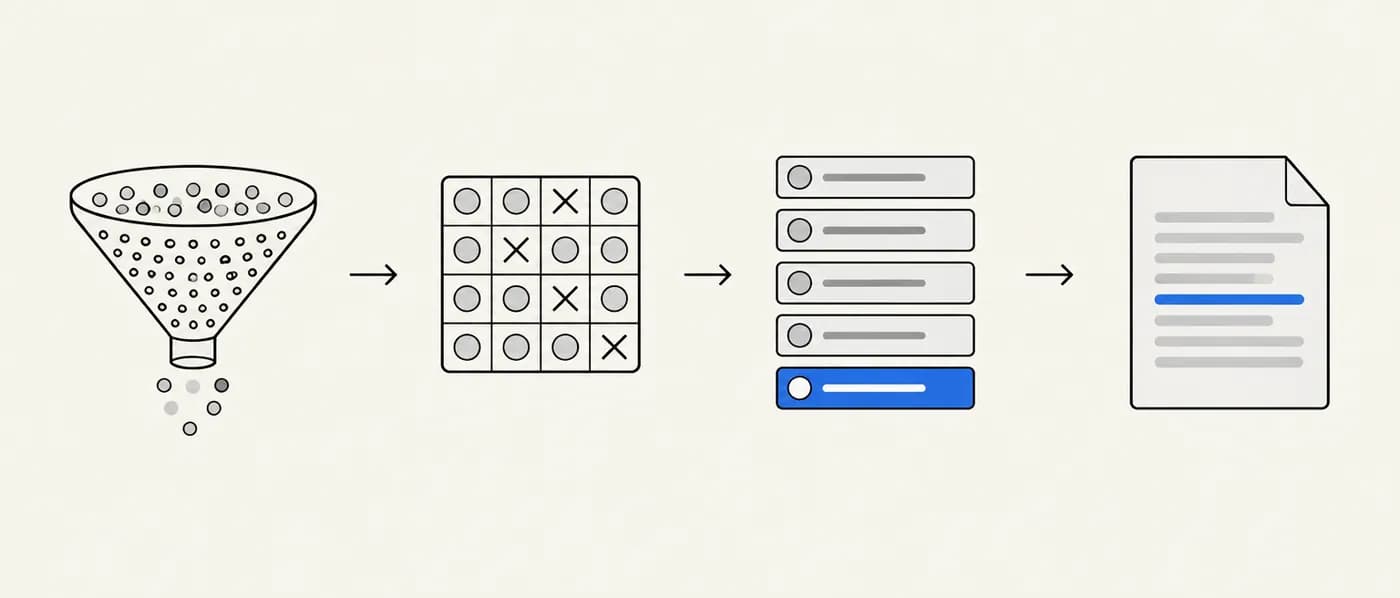
The method has four steps. Translation restates the design requirement as a function (what the part does), constraints (hard limits such as maximum service temperature or required stiffness), an objective (the quantity to minimise or maximise, such as mass or cost) and free variables (dimensions or parameters the designer can adjust). Screening removes every material that violates a constraint. Ranking orders the survivors using a material index — a combination of properties derived from the objective and constraints. Documentation gathers the detailed information (fatigue data, processing, joining, supply, prior use) needed to make the final choice among the top-ranked few.
Although the method was developed for mechanical design, the same logic applies to any materials decision. For a battery cathode, a catalyst support or a semiconductor substrate, the vocabulary changes but the structure does not: hard requirements filter, a figure of merit ranks, and evidence decides.
Why it matters for R&D decisions
Most materials decisions go wrong in one of two ways: a team optimises the wrong quantity, or it ranks candidates before checking a requirement that disqualifies the winner. Writing the brief in Ashby form forces those questions to be answered first. It also makes the decision auditable — a reviewer can see which constraint removed a candidate and which objective ranked the rest, instead of reverse-engineering a spreadsheet. For R&D teams screening thousands of computed or catalogued materials, the translation step is effectively the query specification: constraints become filters and the objective becomes the sort order.
The formula
Light, stiff tie (rod in tension): m = S · L² · (ρ / E)  →  maximise M = E / ρ
Light, stiff beam (square section, bending): m = (12 S / C)^½ · L^(5/2) · (ρ / E^½)  →  maximise M = E^½ / ρ
- m
- Mass of the component (the objective to minimise)
- S
- Required stiffness (a constraint)
- L
- Length, fixed by the design
- C
- Constant set by the loading and support conditions of the beam
- E
- Young’s modulus of the material
- ρ
- Density of the material
- M
- Material index — the combination of properties to maximise
The index is derived by writing the objective (here, mass) as a function of the constraint, the fixed geometry and the material properties, then eliminating the free variable (cross-section area). The material-property group that remains is the index. Different loading modes give different indices, which is why “the stiffest material” and “the best material for a light, stiff beam” are usually different answers.
How to apply it, step by step
- 1Write the function
State in one sentence what the material must do: carry a bending load, store lithium reversibly, conduct heat away from a chip, support a catalyst at 500 °C. Everything else follows from this.
- 2List constraints as hard limits
Constraints are pass/fail: maximum operating temperature, minimum stiffness, an allowed voltage window, no restricted elements, a regulatory requirement. If a requirement can be traded against something else, it belongs in the objective, not here.
- 3Choose one objective and name the free variables
Pick what you want to minimise or maximise — mass, cost, volume, energy, environmental impact. Identify what the designer is free to change, such as wall thickness or particle size. If there is more than one objective, keep them separate and use a Pareto front instead of forcing them together too early.
- 4Screen
Remove every candidate that fails any constraint. Do this before ranking. Record the reason each candidate was removed so the screen can be revisited if a constraint changes.
- 5Rank with an index
Derive the material index from the objective and constraints (see the formula) or use a standard one from the reference table. Sort survivors by the index. Plotting candidates on a property chart with a line of constant index makes the trade-off visible.
- 6Document the top few
For the three to five best candidates, gather the information the index cannot capture: fatigue and corrosion behaviour, processing and joining routes, supply risk, cost at volume, prior use in similar products. The final choice is made here.
Worked examples
Light, stiff tie rod
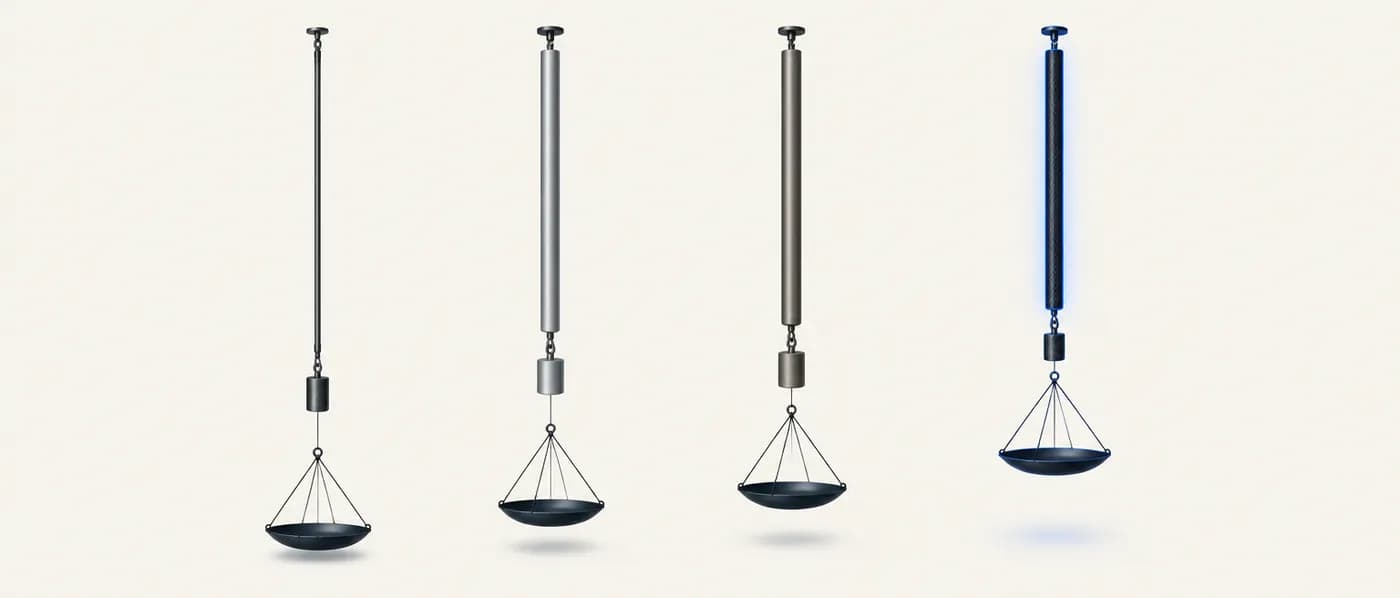
A tension member must have a specified stiffness and fixed length while weighing as little as possible. Free variable: cross-sectional area. Index: E/ρ (GPa per Mg/m³).
- 01Steel: E ≈ 210 GPa, ρ ≈ 7.8 Mg/m³ → E/ρ ≈ 26.9
- 02Aluminium alloy: E ≈ 70 GPa, ρ ≈ 2.7 → E/ρ ≈ 25.9
- 03Titanium alloy (Ti-6Al-4V): E ≈ 114 GPa, ρ ≈ 4.43 → E/ρ ≈ 25.7
- 04Quasi-isotropic CFRP laminate: E ≈ 70 GPa, ρ ≈ 1.6 → E/ρ ≈ 43.8
In pure tension, specific stiffness barely separates the common metals. The choice between them comes down to the documentation step — cost, joining, fatigue, corrosion.
Same materials, a light, stiff beam
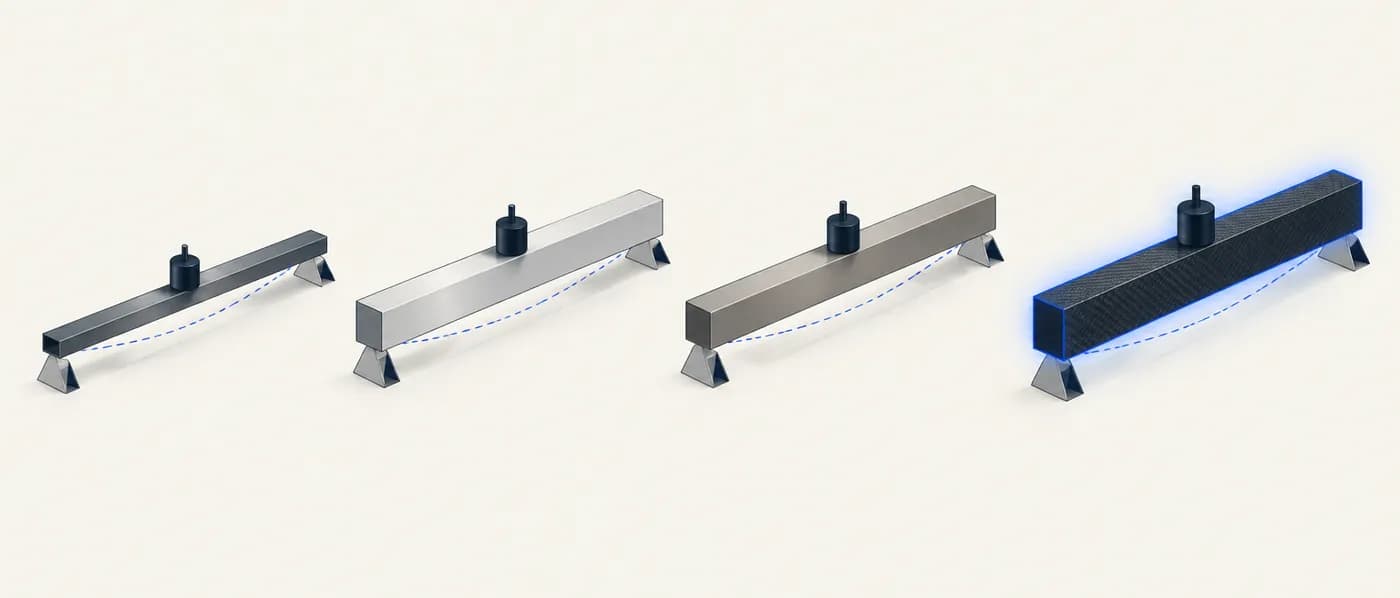
Now the member is loaded in bending, with a square cross-section whose size is free. The index becomes E^½/ρ.
- 01Steel: √210 ≈ 14.5 → 14.5 / 7.8 ≈ 1.86
- 02Aluminium alloy: √70 ≈ 8.37 → 8.37 / 2.7 ≈ 3.10
- 03Titanium alloy: √114 ≈ 10.7 → 10.7 / 4.43 ≈ 2.41
- 04CFRP (quasi-isotropic): 8.37 / 1.6 ≈ 5.23
The loading mode changes the index, and the index changes the ranking. Ranking on a single property (here, E) would have picked steel — the worst of the four for a light, stiff beam.
Choosing a cobalt-free Li-ion cathode
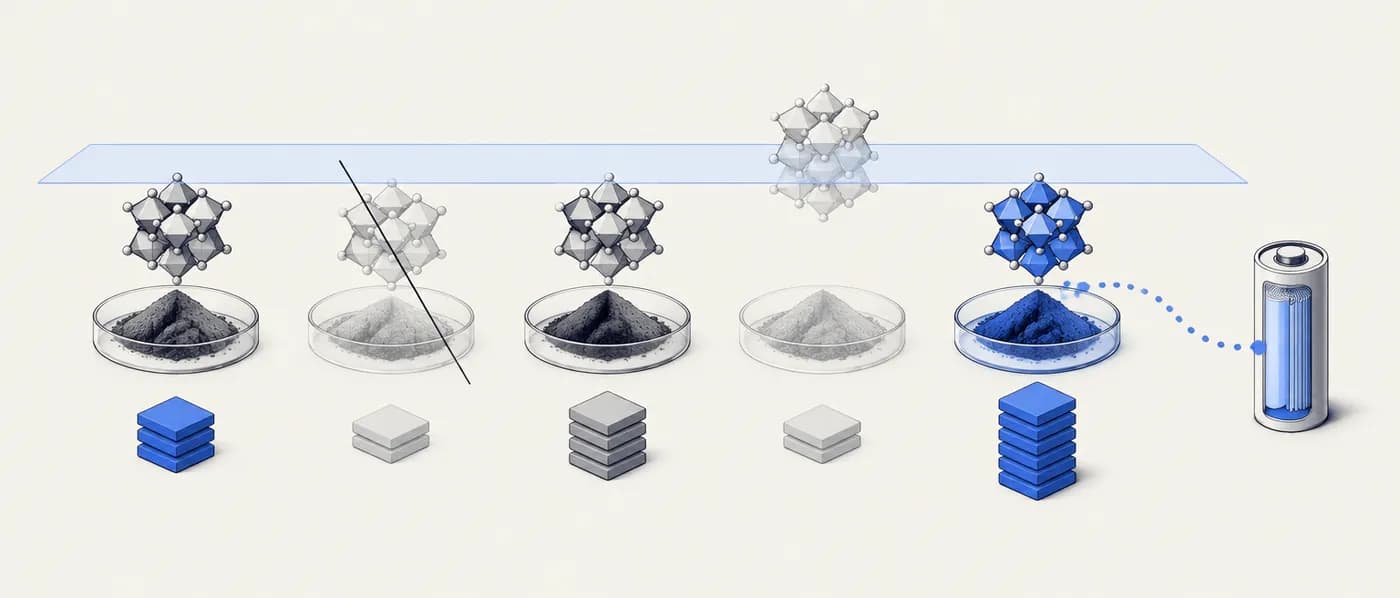
Function: store and release lithium reversibly in a cell. Constraints: no cobalt; average voltage within a conventional carbonate electrolyte window (taken here as ≤ 4.3 V vs Li/Li⁺); known synthesis route. Objective: maximise theoretical specific energy (Wh/kg of cathode material). Free variables: composition and particle engineering.
- 01Candidates: LiFePO₄ (≈170 mAh/g, ≈3.4 V), LiMnPO₄ (≈171 mAh/g, ≈4.1 V), LiMn₂O₄ (≈148 mAh/g, ≈4.0 V), LiNi₀.₅Mn₁.₅O₄ (≈147 mAh/g, ≈4.7 V), LiCoO₂ (≈274 mAh/g theoretical).
- 02Screen — no cobalt: remove LiCoO₂.
- 03Screen — voltage window: remove LiNi₀.₅Mn₁.₅O₄ (≈4.7 V exceeds the 4.3 V limit).
- 04Rank by capacity × voltage: LiMnPO₄ ≈ 171 × 4.1 ≈ 700 Wh/kg; LiMn₂O₄ ≈ 148 × 4.0 ≈ 590 Wh/kg; LiFePO₄ ≈ 170 × 3.4 ≈ 580 Wh/kg.
- 05Document: LiMnPO₄ has poor electronic conductivity and sluggish kinetics; LiMn₂O₄ suffers manganese dissolution at elevated temperature; LiFePO₄ has a mature, low-cost manufacturing base and very good cycle life.
The ranking narrows the field; the documentation step makes the decision. Note the values are theoretical, material-level numbers — practical cell-level energy is much lower.
Common material indices (maximise for minimum mass)
| Component and loading | Stiffness-limited | Strength-limited |
|---|---|---|
| Tie (tension), length fixed, area free | E / ρ | σf / ρ |
| Beam (bending), length fixed, section size free | E^½ / ρ | σf^(2/3) / ρ |
| Panel (bending), length and width fixed, thickness free | E^(1/3) / ρ | σf^½ / ρ |
When to use it — and when not to
- At the start of any materials decision, before searching a database or ordering samples.
- When a team disagrees about which material is “best” — the disagreement is usually about unstated constraints or objectives.
- When screening large computed or catalogued datasets, where the translation step defines the filters and sort order.
- When the decision must be explained to a reviewer, customer or investment committee.
- When properties of interest are not yet known for most candidates — the method ranks known properties; it doesn’t discover new ones.
- When several objectives genuinely conflict and no exchange rate between them exists yet — use a Pareto front first.
- When the choice is dominated by a single non-negotiable factor (an incumbent qualification, a customer specification) that makes ranking irrelevant.
Common mistakes
Applying it in Lattice Graph
Write the brief in Ashby form, then let the constraints become search filters and the objective become the sort order. Use cross-source confidence and your evidence pack for the documentation step.
- 01Enter constraints as filters in materials search (for example, excluded elements, a stability threshold, a property range).
- 02Sort or rank survivors by the property or derived figure of merit that matches your objective, and shortlist the top candidates.
- 03Open each shortlisted material to check cross-source agreement and provenance before trusting its ranking.
- 04Export the shortlist with its sources and confidence as your evidence pack, recording which constraint removed each rejected candidate.
Frequently asked questions
Is the Ashby method only for mechanical parts?
No. It was developed for mechanical design, but the translate–screen–rank–document structure applies to any selection problem. Functional materials need different indices — for example capacity × voltage for a cathode or a band-gap window for a solar absorber — but the logic is the same.
What if I have two objectives, like mass and cost?
Keep them separate and plot the trade-off as a Pareto front. If you can agree an exchange rate between them (how much cost one kilogram saved is worth), you can combine them into a single penalty function, as Ashby describes.
Where do I get the material index?
Derive it by writing the objective as a function of the constraint, fixed geometry and material properties, then eliminating the free variable. Standard indices for ties, beams, panels, columns, springs and thermal problems are tabulated in Ashby’s textbook.
Do computed properties work for ranking?
They can, if you know their systematic errors. Computed elastic moduli are usually reasonable for ranking; computed band gaps from standard DFT are systematically low. Check the evidence tier of each property before relying on the order.
References & further reading
- [1]Ashby, M. F. (2017). Materials Selection in Mechanical Design, 5th edition. Butterworth-Heinemann (Elsevier).The standard reference for the method, material indices and property charts.
- [2]Ashby, M. F. (2000). Multi-objective optimization in material design and selection. Acta Materialia, 48(1), 359–369.Extends the method to conflicting objectives using trade-off surfaces and penalty functions.
- [3]Ashby, M. F., Shercliff, H., & Cebon, D. (2019). Materials: Engineering, Science, Processing and Design, 4th edition. Butterworth-Heinemann.Introductory textbook covering selection with property charts.
- [4]Padhi, A. K., Nanjundaswamy, K. S., & Goodenough, J. B. (1997). Phospho-olivines as positive-electrode materials for rechargeable lithium batteries. Journal of the Electrochemical Society, 144(4), 1188–1194.Original report of LiFePO₄ as a cathode, relevant to the cathode example.